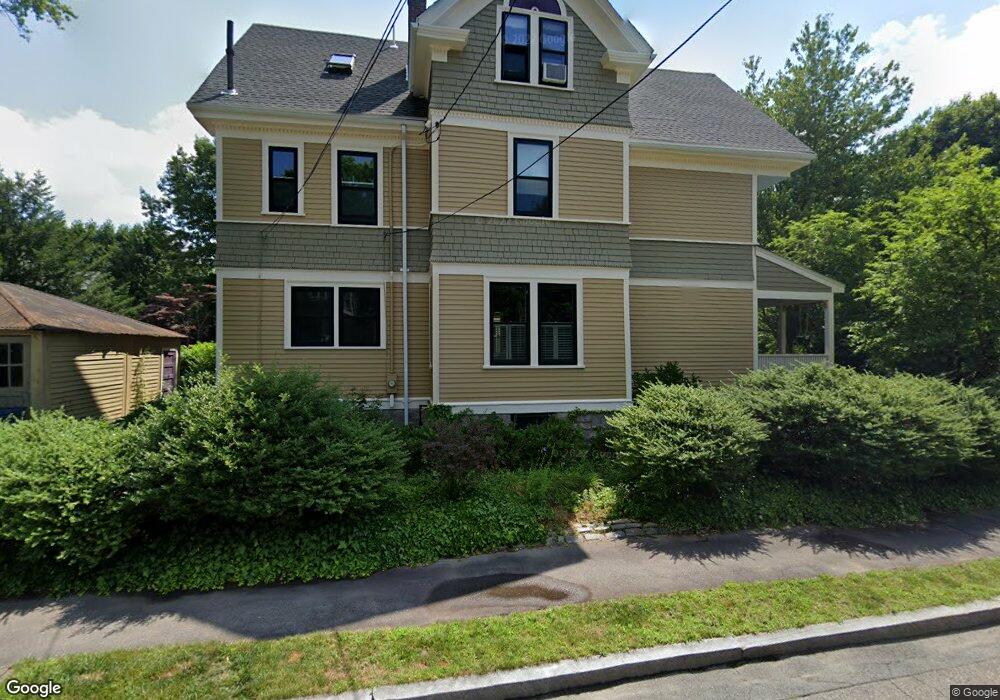
38 Newbury St Newton Center, MA 02459
Newton Centre NeighborhoodEstimated Value: $1,543,000 - $2,072,000
4
Beds
4
Baths
2,170
Sq Ft
$824/Sq Ft
Est. Value
About This Home
This home is located at 38 Newbury St, Newton Center, MA 02459 and is currently estimated at $1,787,889, approximately $823 per square foot. 38 Newbury St is a home located in Middlesex County with nearby schools including Mason Rice Elementary School, Charles E Brown Middle School, and Newton South High School.
Ownership History
Date
Name
Owned For
Owner Type
Purchase Details
Closed on
Nov 22, 1994
Sold by
Est Barker Catherine M and Stpierre Maureen
Bought by
Yarmolinsky Matthew and Lepisitz Margaret
Current Estimated Value
Home Financials for this Owner
Home Financials are based on the most recent Mortgage that was taken out on this home.
Original Mortgage
$170,000
Interest Rate
8.9%
Mortgage Type
Purchase Money Mortgage
Create a Home Valuation Report for This Property
The Home Valuation Report is an in-depth analysis detailing your home's value as well as a comparison with similar homes in the area
Home Values in the Area
Average Home Value in this Area
Purchase History
| Date | Buyer | Sale Price | Title Company |
|---|---|---|---|
| Yarmolinsky Matthew | $299,000 | -- |
Source: Public Records
Mortgage History
| Date | Status | Borrower | Loan Amount |
|---|---|---|---|
| Open | Yarmolinsky Matthew | $185,000 | |
| Closed | Yarmolinsky Matthew | $170,000 |
Source: Public Records
Tax History Compared to Growth
Tax History
| Year | Tax Paid | Tax Assessment Tax Assessment Total Assessment is a certain percentage of the fair market value that is determined by local assessors to be the total taxable value of land and additions on the property. | Land | Improvement |
|---|---|---|---|---|
| 2025 | $14,001 | $1,428,700 | $855,400 | $573,300 |
| 2024 | $13,538 | $1,387,100 | $830,500 | $556,600 |
| 2023 | $12,802 | $1,257,600 | $621,600 | $636,000 |
| 2022 | $12,249 | $1,164,400 | $575,600 | $588,800 |
| 2021 | $11,820 | $1,098,500 | $543,000 | $555,500 |
| 2020 | $11,468 | $1,098,500 | $543,000 | $555,500 |
| 2019 | $11,145 | $1,066,500 | $527,200 | $539,300 |
| 2018 | $10,660 | $985,200 | $477,800 | $507,400 |
| 2017 | $10,335 | $929,400 | $450,800 | $478,600 |
| 2016 | $8,848 | $777,500 | $421,300 | $356,200 |
| 2015 | $8,404 | $723,900 | $393,700 | $330,200 |
Source: Public Records
Map
Nearby Homes
- 956 Walnut St Unit 4
- 956 Walnut St Unit 7
- 956 Walnut St Unit 6
- 54 Garland Rd
- Lot 3 Chapin Rd
- Lot 2 Chapin Rd
- Lots 2 & 3 Chapin Rd
- 1114 Beacon St Unit 106
- 1114 Beacon St Unit 203
- 1114 Beacon St Unit 111
- 1114 Beacon St Unit 104
- 1114 Beacon St Unit 207
- 28 Wilson Cir Unit 28
- 32 Wilson Cir Unit 32
- 26 Wilson Cir Unit 26
- 59 Charlotte Rd
- 2 Raeburn Terrace
- 9 Ripley St Unit 1
- 887 Commonwealth Ave
- 1597 Centre St Unit 1597
- 42 Newbury St Unit 2
- 42 Newbury St Unit 1
- 3 Newbury Terrace
- 46 Newbury St
- 7 Newbury Terrace
- 7 Newbury Terrace Unit 1
- 3 Albion Place
- 35 Newbury St
- 11 Newbury Terrace
- 21 Newbury St
- 45 Newbury St
- 27 Crystal St
- 6 Albion Place
- 24 Albion St
- 19 Crystal St
- 2 Newbury Terrace
- 6 Newbury Terrace
- 11 Newbury St
- 10 Newbury Terrace
- 21 Moreland Ave