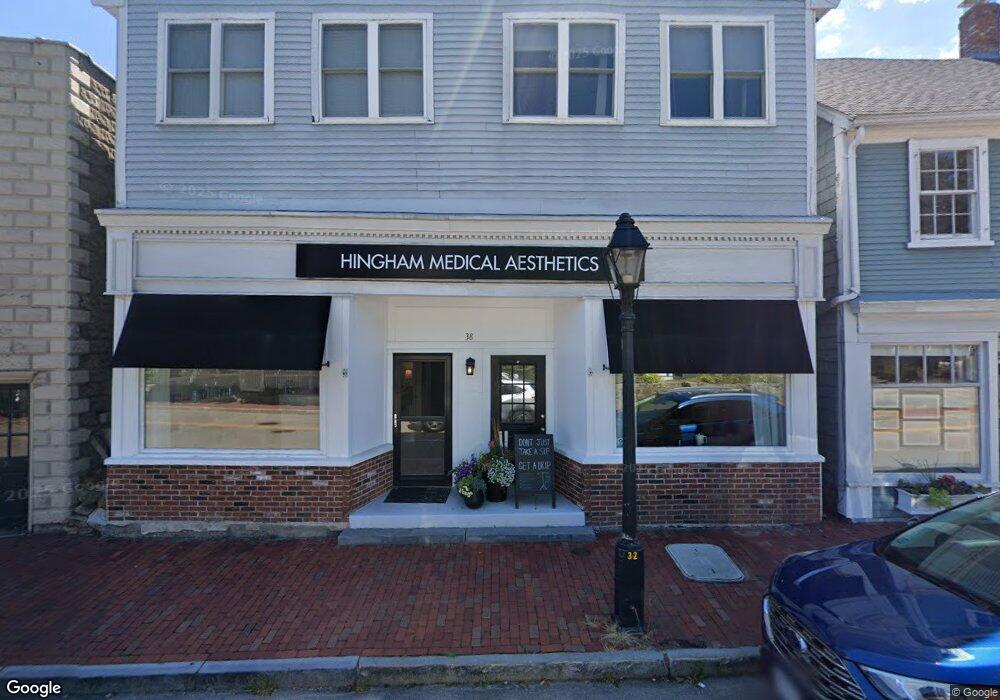
38 North St Hingham, MA 02043
2
Beds
4
Baths
3,000
Sq Ft
3,485
Sq Ft Lot
About This Home
This home is located at 38 North St, Hingham, MA 02043. 38 North St is a home located in Plymouth County with nearby schools including William L. Foster Elementary School, Hingham Middle School, and Hingham High School.
Ownership History
Date
Name
Owned For
Owner Type
Purchase Details
Closed on
Nov 20, 2014
Sold by
Bouserhal Antoine and Bouserhal Siham
Bought by
Imagine Partners Llc
Home Financials for this Owner
Home Financials are based on the most recent Mortgage that was taken out on this home.
Original Mortgage
$918,000
Outstanding Balance
$706,576
Interest Rate
4.13%
Mortgage Type
Commercial
Purchase Details
Closed on
Feb 12, 2014
Sold by
Dauphinais Leo E and Dauphinais Mary F
Bought by
Bouserhal Antoine and Bouserhal Siham
Purchase Details
Closed on
Aug 16, 2000
Sold by
Dauphinais Leo E and Dauphinais Mary F
Bought by
Bouserhal Antonie and Bouserhal Siham
Home Financials for this Owner
Home Financials are based on the most recent Mortgage that was taken out on this home.
Original Mortgage
$243,000
Interest Rate
8.13%
Mortgage Type
Commercial
Create a Home Valuation Report for This Property
The Home Valuation Report is an in-depth analysis detailing your home's value as well as a comparison with similar homes in the area
Purchase History
| Date | Buyer | Sale Price | Title Company |
|---|---|---|---|
| Imagine Partners Llc | $860,000 | -- | |
| Bouserhal Antoine | $325,000 | -- | |
| Bouserhal Antonie | $325,000 | -- |
Source: Public Records
Mortgage History
| Date | Status | Borrower | Loan Amount |
|---|---|---|---|
| Open | Imagine Partners Llc | $918,000 | |
| Previous Owner | Bouserhal Antonie | $243,000 |
Source: Public Records
Tax History
| Year | Tax Paid | Tax Assessment Tax Assessment Total Assessment is a certain percentage of the fair market value that is determined by local assessors to be the total taxable value of land and additions on the property. | Land | Improvement |
|---|---|---|---|---|
| 2025 | $9,978 | $933,400 | $493,100 | $440,300 |
| 2024 | $10,127 | $933,400 | $493,100 | $440,300 |
| 2023 | $9,334 | $933,400 | $493,100 | $440,300 |
| 2022 | $9,799 | $847,700 | $502,300 | $345,400 |
| 2021 | $9,668 | $819,300 | $473,900 | $345,400 |
| 2020 | $9,272 | $804,200 | $473,900 | $330,300 |
| 2019 | $9,498 | $804,200 | $473,900 | $330,300 |
| 2018 | $9,465 | $804,200 | $473,900 | $330,300 |
| 2017 | $7,033 | $574,100 | $315,100 | $259,000 |
| 2016 | $6,830 | $546,800 | $300,100 | $246,700 |
| 2015 | $6,851 | $546,800 | $300,100 | $246,700 |
Source: Public Records
Map
Nearby Homes
- 38 North St Unit A
- 38 North St Unit B
- 38 North St Unit D
- 38 North St Unit 2nd
- 38 North St Unit Apartment
- 38 North St Unit 2
- 24 Station St
- 40 North St Unit 2
- 40 North St Unit 2B
- 40 North St Unit 2A
- 40 North St
- 28 Station St
- 34 North St
- 34 North St Unit 1
- 41 North St
- 41 North St Unit HOUSE
- 41 North St Unit n/a
- 42 North St Unit 1
- 42 North St
- 35 North St
Your Personal Tour Guide
Ask me questions while you tour the home.