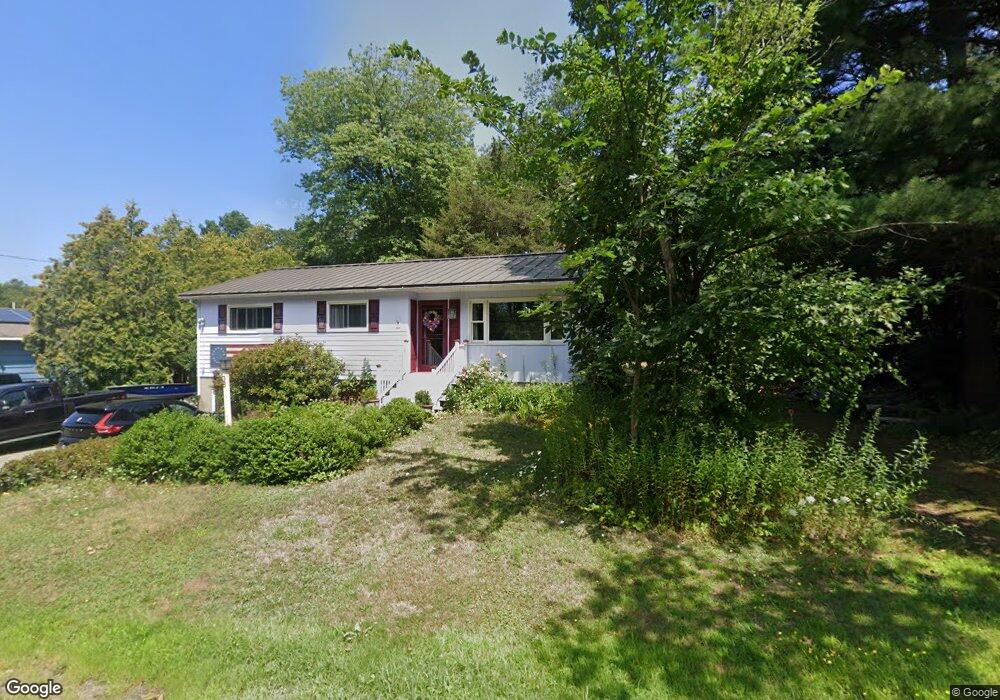
38 Orchard St Byfield, MA 01922
Estimated Value: $657,000 - $1,150,000
3
Beds
2
Baths
1,476
Sq Ft
$537/Sq Ft
Est. Value
About This Home
This home is located at 38 Orchard St, Byfield, MA 01922 and is currently estimated at $791,994, approximately $536 per square foot. 38 Orchard St is a home located in Essex County with nearby schools including Triton Regional High School and The Governors Academy.
Ownership History
Date
Name
Owned For
Owner Type
Purchase Details
Closed on
Sep 24, 2021
Sold by
Zarrella Paul G
Bought by
Paul G Zarrella T
Current Estimated Value
Purchase Details
Closed on
Feb 6, 1963
Bought by
Zarrella Paul G and Zarrella Deborah
Create a Home Valuation Report for This Property
The Home Valuation Report is an in-depth analysis detailing your home's value as well as a comparison with similar homes in the area
Home Values in the Area
Average Home Value in this Area
Purchase History
| Date | Buyer | Sale Price | Title Company |
|---|---|---|---|
| Paul G Zarrella T | -- | None Available | |
| Paul G Zarrella T G | -- | None Available | |
| Paul G Zarrella T G | -- | None Available | |
| Zarrella Paul G | -- | -- |
Source: Public Records
Mortgage History
| Date | Status | Borrower | Loan Amount |
|---|---|---|---|
| Previous Owner | Zarrella Paul G | $75,000 | |
| Previous Owner | Zarrella Paul G | $82,000 |
Source: Public Records
Tax History Compared to Growth
Tax History
| Year | Tax Paid | Tax Assessment Tax Assessment Total Assessment is a certain percentage of the fair market value that is determined by local assessors to be the total taxable value of land and additions on the property. | Land | Improvement |
|---|---|---|---|---|
| 2025 | $4,277 | $574,100 | $285,800 | $288,300 |
| 2024 | $4,343 | $565,500 | $285,800 | $279,700 |
| 2023 | $4,234 | $488,400 | $266,700 | $221,700 |
| 2022 | $4,058 | $417,100 | $228,600 | $188,500 |
| 2021 | $3,916 | $367,400 | $190,500 | $176,900 |
| 2020 | $4,038 | $367,400 | $190,500 | $176,900 |
| 2019 | $3,972 | $367,400 | $190,500 | $176,900 |
| 2018 | $3,763 | $345,200 | $184,800 | $160,400 |
| 2017 | $3,591 | $338,500 | $184,800 | $153,700 |
| 2016 | $3,700 | $324,600 | $171,500 | $153,100 |
| 2015 | $3,291 | $285,700 | $133,400 | $152,300 |
| 2014 | $3,060 | $270,300 | $123,800 | $146,500 |
Source: Public Records
Map
Nearby Homes
- 254 Middle Rd
- 36 Caldwell Farm Rd
- 64 Caldwell Farm Rd Unit 64
- 55 Pearson Dr Unit 9 - ALDER
- 55 Pearson Dr Unit 3 - ALDER
- 55 Pearson Dr Unit 8-Dogwood
- 55 Pearson Dr Unit 11-Chestnut
- 55 Pearson Dr Unit 6-Dogwood
- 15 School St
- 4 Coleman Rd
- 62 Middle Rd
- 34 Central St
- 13 Turkey Hill Rd
- 601 Newburyport Turnpike
- 6 Parker River Dr
- 15 Central St
- 137 Indian Hill St
- 66 3 Parish Rd
- 66 2 Parish Rd
- 1 Osprey Ct