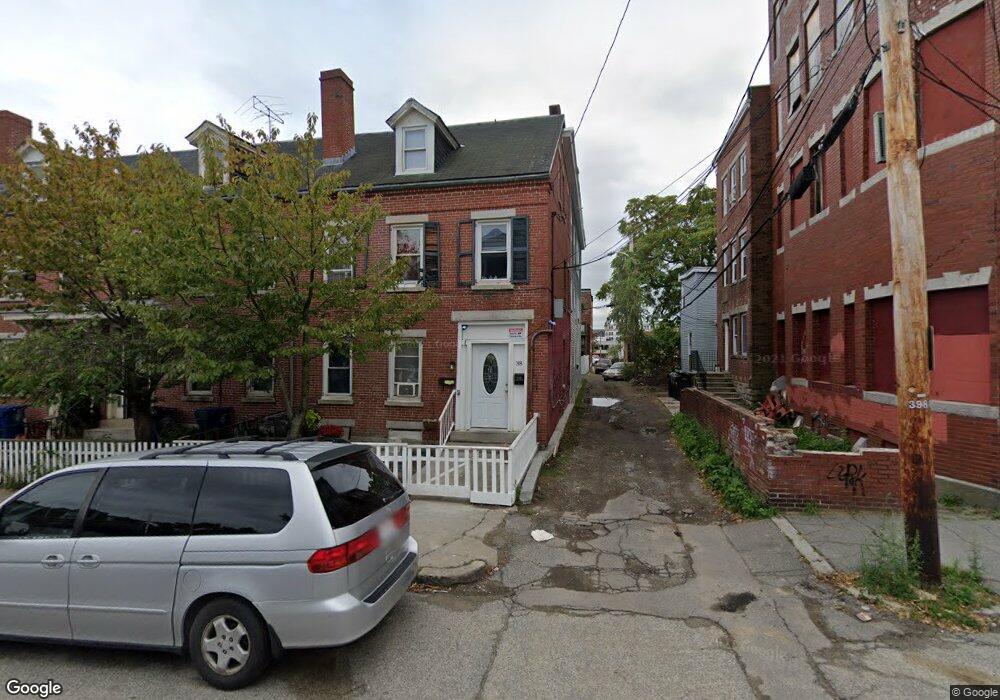
38 Orchard St Lawrence, MA 01840
Downtown Lawrence NeighborhoodEstimated Value: $450,000 - $735,000
9
Beds
3
Baths
2,060
Sq Ft
$294/Sq Ft
Est. Value
About This Home
This home is located at 38 Orchard St, Lawrence, MA 01840 and is currently estimated at $604,763, approximately $293 per square foot. 38 Orchard St is a home located in Essex County with nearby schools including Olive Branch Elementary School, Hawkins Elementary SMART School, and School For Exceptional Studies.
Ownership History
Date
Name
Owned For
Owner Type
Purchase Details
Closed on
Dec 1, 2006
Sold by
Cepeda Josepina
Bought by
Cepeda Josepina and Mora Antonio
Current Estimated Value
Home Financials for this Owner
Home Financials are based on the most recent Mortgage that was taken out on this home.
Original Mortgage
$306,000
Interest Rate
6.36%
Mortgage Type
Purchase Money Mortgage
Purchase Details
Closed on
Mar 2, 2006
Sold by
Reyes Margarita
Bought by
Cepeda Josefina and Cepeda Josefina M
Home Financials for this Owner
Home Financials are based on the most recent Mortgage that was taken out on this home.
Original Mortgage
$290,000
Interest Rate
6.16%
Mortgage Type
Purchase Money Mortgage
Purchase Details
Closed on
Dec 26, 2000
Sold by
Torres Julio Est and Torres Yolanda
Bought by
Reyes Margarita
Purchase Details
Closed on
Aug 30, 1991
Sold by
Community Sb
Bought by
Torres Julio
Create a Home Valuation Report for This Property
The Home Valuation Report is an in-depth analysis detailing your home's value as well as a comparison with similar homes in the area
Home Values in the Area
Average Home Value in this Area
Purchase History
| Date | Buyer | Sale Price | Title Company |
|---|---|---|---|
| Cepeda Josepina | -- | -- | |
| Cepeda Josefina | $290,000 | -- | |
| Reyes Margarita | $119,000 | -- | |
| Torres Julio | $75,000 | -- |
Source: Public Records
Mortgage History
| Date | Status | Borrower | Loan Amount |
|---|---|---|---|
| Open | Torres Julio | $348,703 | |
| Closed | Cepeda Josepina | $306,000 | |
| Previous Owner | Cepeda Josefina | $290,000 | |
| Previous Owner | Torres Julio | $133,726 |
Source: Public Records
Tax History Compared to Growth
Tax History
| Year | Tax Paid | Tax Assessment Tax Assessment Total Assessment is a certain percentage of the fair market value that is determined by local assessors to be the total taxable value of land and additions on the property. | Land | Improvement |
|---|---|---|---|---|
| 2025 | $4,719 | $536,200 | $84,100 | $452,100 |
| 2024 | $4,472 | $483,500 | $88,400 | $395,100 |
| 2023 | $4,625 | $455,200 | $85,300 | $369,900 |
| 2022 | $4,201 | $367,200 | $80,500 | $286,700 |
| 2021 | $3,972 | $323,700 | $80,500 | $243,200 |
| 2020 | $3,853 | $310,000 | $67,000 | $243,000 |
| 2019 | $3,711 | $271,300 | $49,800 | $221,500 |
| 2018 | $3,548 | $247,800 | $45,100 | $202,700 |
| 2017 | $3,317 | $216,200 | $42,800 | $173,400 |
| 2016 | $3,094 | $199,500 | $33,400 | $166,100 |
| 2015 | $2,967 | $196,200 | $33,400 | $162,800 |
Source: Public Records
Map
Nearby Homes
- 32 Orchard St
- 42 Union St
- 89 Newbury St Unit 89B
- 6 Brook St
- 192 Union St
- 65 Brook St
- 11 Lawrence St Unit 606
- 46 Amesbury St Unit 2B
- 46 Amesbury St Unit 4D
- 19-21 Pleasant Terrace
- 131A Lawrence St Unit 40
- 100-102 E Haverhill St
- 7 Stevens Ct
- 52 Howard St
- 80 Ferry St Unit 80A
- 80 Market St
- 35 Kendall St
- 24 Bennington St
- 167 Ferry 53 Mann St Unit 2,5,6
- 64 Salem St
- 36 Orchard St
- 34 Orchard St
- 55 Newbury St Unit 55A
- 55 Newbury St Unit 3b
- 55 Newbury St Unit 2F
- 55 Newbury St Unit 3f
- 53 Newbury St Unit 53A
- 57 Newbury St Unit 57B
- 30 Orchard St
- 28 Orchard St
- 137 Garden St
- 135 Garden St
- 26 Orchard St
- 139 Garden St
- 139 Garden St Unit 3
- 139 Garden St Unit 1
- 131 Garden St
- 24 Orchard St
- 35 Orchard St
- 129 Garden St