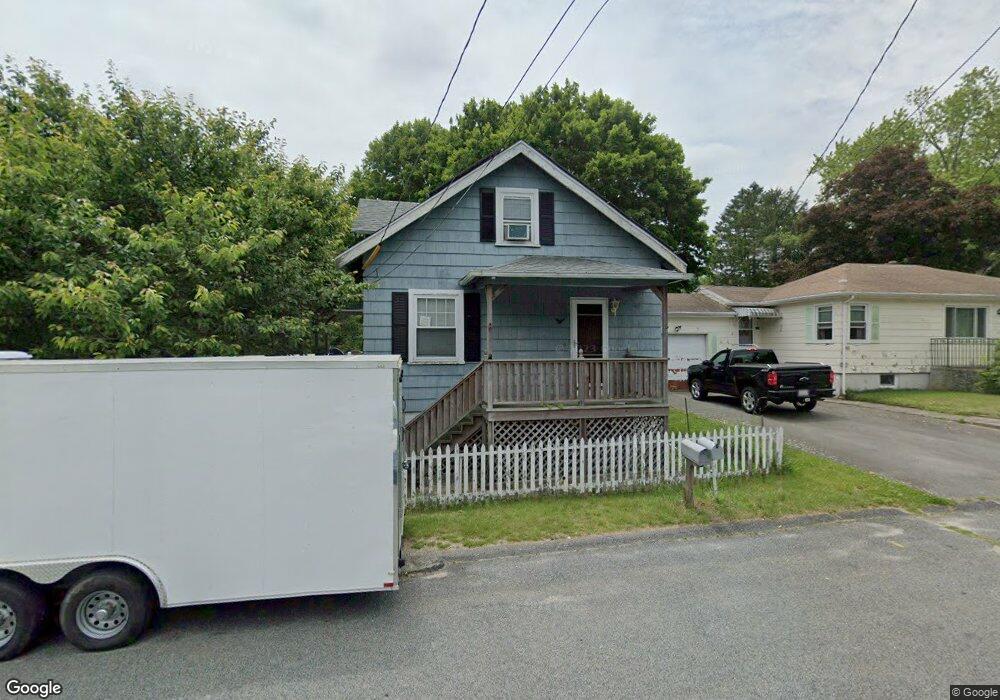
38 Osborn St Westport, MA 02790
North Westport NeighborhoodEstimated Value: $335,000 - $412,000
3
Beds
5
Baths
915
Sq Ft
$408/Sq Ft
Est. Value
About This Home
This home is located at 38 Osborn St, Westport, MA 02790 and is currently estimated at $373,715, approximately $408 per square foot. 38 Osborn St is a home located in Bristol County with nearby schools including Alice A. Macomber Primary School, Westport Elementary School, and Westport Middle-High School.
Ownership History
Date
Name
Owned For
Owner Type
Purchase Details
Closed on
Oct 29, 1999
Sold by
Silva John and Silva Natalie
Bought by
Bolger Timothy P and Bolger Dawn M
Current Estimated Value
Home Financials for this Owner
Home Financials are based on the most recent Mortgage that was taken out on this home.
Original Mortgage
$116,900
Outstanding Balance
$35,770
Interest Rate
7.78%
Mortgage Type
Purchase Money Mortgage
Estimated Equity
$337,945
Purchase Details
Closed on
Nov 1, 1989
Sold by
Rego Ronald
Bought by
Silva John
Home Financials for this Owner
Home Financials are based on the most recent Mortgage that was taken out on this home.
Original Mortgage
$103,100
Interest Rate
9.9%
Mortgage Type
Purchase Money Mortgage
Create a Home Valuation Report for This Property
The Home Valuation Report is an in-depth analysis detailing your home's value as well as a comparison with similar homes in the area
Home Values in the Area
Average Home Value in this Area
Purchase History
| Date | Buyer | Sale Price | Title Company |
|---|---|---|---|
| Bolger Timothy P | $118,000 | -- | |
| Silva John | $112,000 | -- |
Source: Public Records
Mortgage History
| Date | Status | Borrower | Loan Amount |
|---|---|---|---|
| Open | Silva John | $116,900 | |
| Previous Owner | Silva John | $100,500 | |
| Previous Owner | Silva John | $10,272 | |
| Previous Owner | Silva John | $103,100 |
Source: Public Records
Tax History
| Year | Tax Paid | Tax Assessment Tax Assessment Total Assessment is a certain percentage of the fair market value that is determined by local assessors to be the total taxable value of land and additions on the property. | Land | Improvement |
|---|---|---|---|---|
| 2025 | $2,026 | $271,900 | $144,900 | $127,000 |
| 2024 | $1,890 | $244,500 | $134,200 | $110,300 |
| 2023 | $1,792 | $219,600 | $121,800 | $97,800 |
| 2022 | $1,671 | $197,100 | $115,700 | $81,400 |
| 2021 | $1,608 | $186,600 | $105,200 | $81,400 |
| 2020 | $1,492 | $177,000 | $95,600 | $81,400 |
| 2019 | $2,489 | $172,100 | $95,600 | $76,500 |
| 2018 | $1,240 | $151,800 | $83,200 | $68,600 |
| 2017 | $1,240 | $155,600 | $88,900 | $66,700 |
| 2016 | $1,194 | $151,000 | $84,300 | $66,700 |
| 2015 | $1,210 | $152,600 | $96,900 | $55,700 |
Source: Public Records
Map
Nearby Homes
- 13 3rd Ave
- 116 Gifford Rd
- 16 Lenox Ave
- 15 S Breault St
- 2 Van Buren St
- 0 Hertitage Acres
- 565 Highland Ave
- 100 D Dr
- 2 Fieldstone Dr
- 0 American Legion Hwy Unit 73473517
- 3 Diane Way
- 2 Winterberry Ln
- 358 Briggs Rd
- 588 Gifford Rd
- 1276 Old Fall River Rd
- 300 Davis Rd
- 343 Old Bedford Rd
- 19 Charles Joseph Dr
- 2 Donna Marie Dr
- 320-322 Old Bedford Rd
Your Personal Tour Guide
Ask me questions while you tour the home.