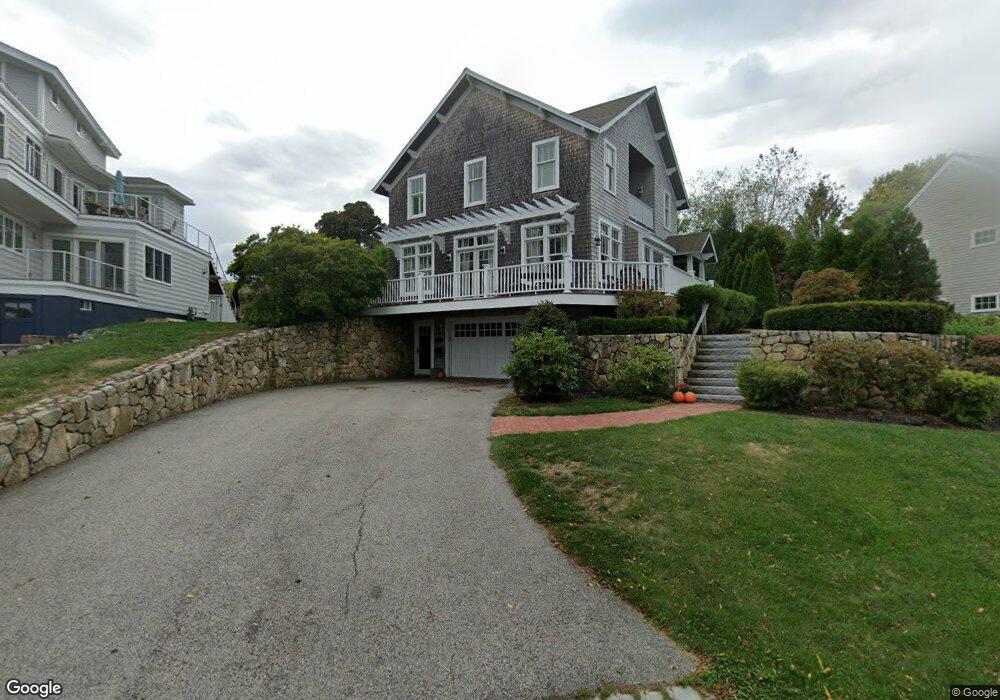
38 Otis Hill Rd Hingham, MA 02043
Crow Point NeighborhoodEstimated Value: $1,509,000 - $2,416,000
3
Beds
2
Baths
1,655
Sq Ft
$1,269/Sq Ft
Est. Value
About This Home
This home is located at 38 Otis Hill Rd, Hingham, MA 02043 and is currently estimated at $2,100,698, approximately $1,269 per square foot. 38 Otis Hill Rd is a home located in Plymouth County with nearby schools including William L. Foster Elementary School, Hingham Middle School, and Hingham High School.
Ownership History
Date
Name
Owned For
Owner Type
Purchase Details
Closed on
Sep 15, 2003
Sold by
Almeida Susan and Paterson Maureen S
Bought by
Ackerman Todd Y and Ackerman Nicole M
Current Estimated Value
Home Financials for this Owner
Home Financials are based on the most recent Mortgage that was taken out on this home.
Original Mortgage
$488,000
Interest Rate
6.22%
Mortgage Type
Purchase Money Mortgage
Purchase Details
Closed on
Sep 16, 1996
Sold by
Mayo Joseph P and Mayo Judith A
Bought by
Almeida Susan and Paterson Maureen S
Create a Home Valuation Report for This Property
The Home Valuation Report is an in-depth analysis detailing your home's value as well as a comparison with similar homes in the area
Home Values in the Area
Average Home Value in this Area
Purchase History
| Date | Buyer | Sale Price | Title Company |
|---|---|---|---|
| Ackerman Todd Y | $610,000 | -- | |
| Almeida Susan | $260,000 | -- |
Source: Public Records
Mortgage History
| Date | Status | Borrower | Loan Amount |
|---|---|---|---|
| Open | Almeida Susan | $1,000,000 | |
| Closed | Almeida Susan | $488,000 |
Source: Public Records
Tax History
| Year | Tax Paid | Tax Assessment Tax Assessment Total Assessment is a certain percentage of the fair market value that is determined by local assessors to be the total taxable value of land and additions on the property. | Land | Improvement |
|---|---|---|---|---|
| 2025 | $20,070 | $1,877,500 | $941,900 | $935,600 |
| 2024 | $19,933 | $1,837,100 | $941,900 | $895,200 |
| 2023 | $17,462 | $1,746,200 | $941,900 | $804,300 |
| 2022 | $15,855 | $1,371,500 | $784,900 | $586,600 |
| 2021 | $2,636 | $1,332,200 | $817,600 | $514,600 |
| 2020 | $15,360 | $1,332,200 | $817,600 | $514,600 |
| 2019 | $15,622 | $1,322,800 | $817,600 | $505,200 |
| 2018 | $15,459 | $1,313,400 | $817,600 | $495,800 |
| 2017 | $12,885 | $1,051,800 | $556,600 | $495,200 |
| 2016 | $13,141 | $1,052,100 | $530,100 | $522,000 |
| 2015 | $13,203 | $1,053,700 | $504,900 | $548,800 |
Source: Public Records
Map
Nearby Homes
- 142 Otis St
- 67 Governor Long Rd
- 28 Marsh St
- 54 Lincoln St
- 33 Lincoln St
- 59 Cottage St
- 57 North St Unit 1
- 143 South St
- 37 Foley Beach Rd
- 2 Langlee Rd
- 190 South St Unit B
- 191 South St
- 43 Park View Dr
- 12 Lafayette Ave
- 272 North St
- 16 Foley Beach Rd
- 21 Hersey St
- 31 Chief Justice Cushing Hwy
- 160 Hms Stayner Dr Unit 160
- 81 Kimball Beach Rd
Your Personal Tour Guide
Ask me questions while you tour the home.