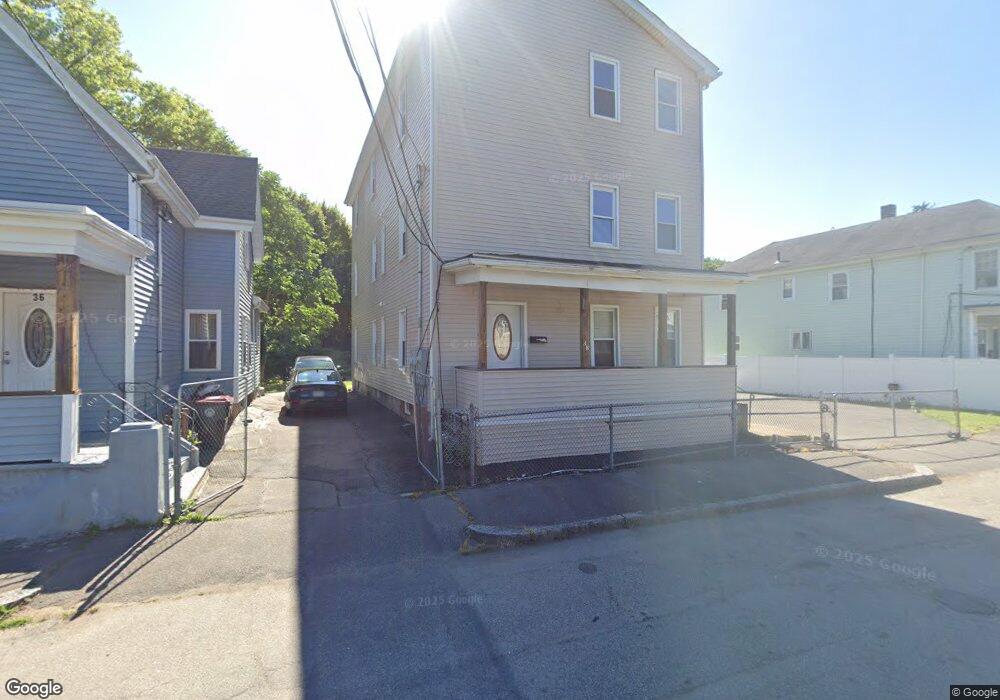
38 Otis St Brockton, MA 02302
Clifton Heights NeighborhoodEstimated Value: $853,000 - $941,000
9
Beds
3
Baths
3,267
Sq Ft
$278/Sq Ft
Est. Value
About This Home
This home is located at 38 Otis St, Brockton, MA 02302 and is currently estimated at $908,333, approximately $278 per square foot. 38 Otis St is a home located in Plymouth County with nearby schools including Arnone Elementary School, Joseph F. Plouffe Middle School, and Trinity Catholic Academy.
Ownership History
Date
Name
Owned For
Owner Type
Purchase Details
Closed on
Mar 5, 2003
Sold by
Depina Maria
Bought by
Monteiro Maria
Current Estimated Value
Home Financials for this Owner
Home Financials are based on the most recent Mortgage that was taken out on this home.
Original Mortgage
$109,500
Interest Rate
5.95%
Mortgage Type
Purchase Money Mortgage
Purchase Details
Closed on
May 14, 1996
Sold by
Giovanniello R P Est
Bought by
Depina Maria
Home Financials for this Owner
Home Financials are based on the most recent Mortgage that was taken out on this home.
Original Mortgage
$68,100
Interest Rate
7.67%
Mortgage Type
Purchase Money Mortgage
Create a Home Valuation Report for This Property
The Home Valuation Report is an in-depth analysis detailing your home's value as well as a comparison with similar homes in the area
Home Values in the Area
Average Home Value in this Area
Purchase History
| Date | Buyer | Sale Price | Title Company |
|---|---|---|---|
| Monteiro Maria | -- | -- | |
| Depina Maria | $68,300 | -- |
Source: Public Records
Mortgage History
| Date | Status | Borrower | Loan Amount |
|---|---|---|---|
| Open | Depina Maria | $150,000 | |
| Closed | Depina Maria | $109,500 | |
| Previous Owner | Depina Maria | $10,534 | |
| Previous Owner | Depina Maria | $68,100 |
Source: Public Records
Tax History Compared to Growth
Tax History
| Year | Tax Paid | Tax Assessment Tax Assessment Total Assessment is a certain percentage of the fair market value that is determined by local assessors to be the total taxable value of land and additions on the property. | Land | Improvement |
|---|---|---|---|---|
| 2025 | $9,267 | $765,200 | $140,800 | $624,400 |
| 2024 | $9,003 | $749,000 | $140,800 | $608,200 |
| 2023 | $8,886 | $684,600 | $107,700 | $576,900 |
| 2022 | $8,170 | $584,800 | $97,900 | $486,900 |
| 2021 | $8,335 | $574,800 | $82,100 | $492,700 |
| 2020 | $7,673 | $506,500 | $76,200 | $430,300 |
| 2019 | $3,498 | $225,100 | $74,100 | $151,000 |
| 2018 | $2,785 | $173,400 | $74,100 | $99,300 |
| 2017 | $2,771 | $172,100 | $74,100 | $98,000 |
| 2016 | $4,491 | $258,700 | $72,000 | $186,700 |
| 2015 | $3,298 | $181,700 | $72,000 | $109,700 |
| 2014 | $3,379 | $186,400 | $72,000 | $114,400 |
Source: Public Records
Map
Nearby Homes