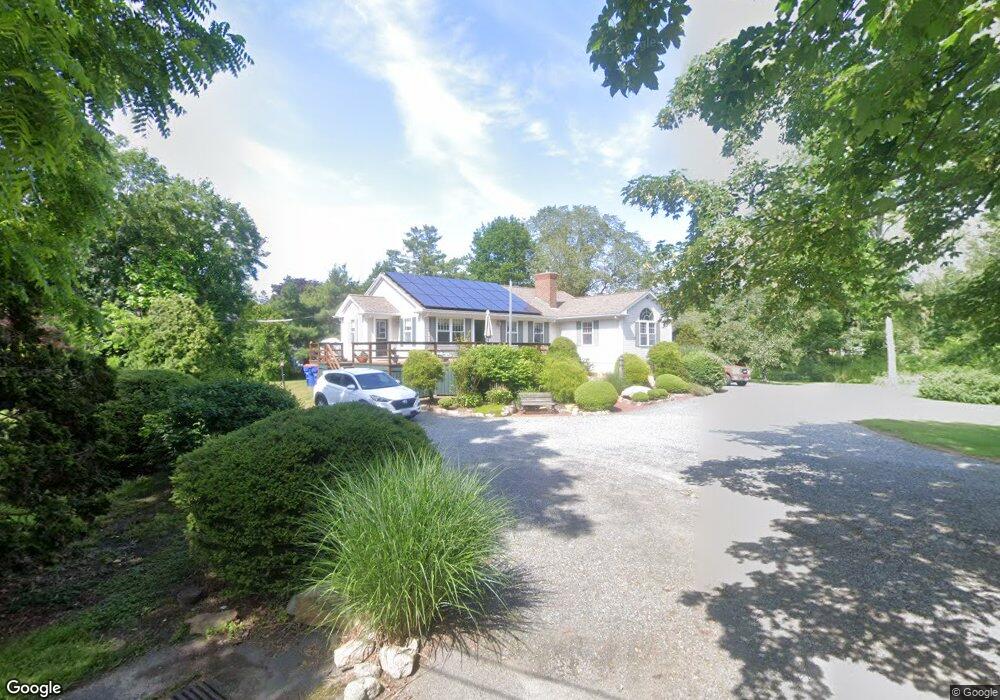
38 Phoenix St Fairhaven, MA 02719
Estimated Value: $559,000 - $669,000
4
Beds
2
Baths
1,552
Sq Ft
$385/Sq Ft
Est. Value
About This Home
This home is located at 38 Phoenix St, Fairhaven, MA 02719 and is currently estimated at $598,154, approximately $385 per square foot. 38 Phoenix St is a home located in Bristol County with nearby schools including Fairhaven High School, City On A Hill Charter Public School New Bedford, and St. Joseph School.
Ownership History
Date
Name
Owned For
Owner Type
Purchase Details
Closed on
Jan 6, 2026
Sold by
Tapper Christopher J and Tapper Diane M
Bought by
Tapper Ft and Tapper
Current Estimated Value
Purchase Details
Closed on
Oct 22, 1996
Sold by
Mitchell David J and Mitchell Claudia J
Bought by
Tapper Christoper J and Tapper Diane Ms
Home Financials for this Owner
Home Financials are based on the most recent Mortgage that was taken out on this home.
Original Mortgage
$90,000
Interest Rate
7.99%
Create a Home Valuation Report for This Property
The Home Valuation Report is an in-depth analysis detailing your home's value as well as a comparison with similar homes in the area
Home Values in the Area
Average Home Value in this Area
Purchase History
| Date | Buyer | Sale Price | Title Company |
|---|---|---|---|
| Tapper Ft | -- | -- | |
| Tapper Christoper J | $15,000 | -- |
Source: Public Records
Mortgage History
| Date | Status | Borrower | Loan Amount |
|---|---|---|---|
| Previous Owner | Tapper Christoper J | $65,000 | |
| Previous Owner | Tapper Christoper J | $86,000 | |
| Previous Owner | Tapper Christoper J | $90,000 |
Source: Public Records
Tax History
| Year | Tax Paid | Tax Assessment Tax Assessment Total Assessment is a certain percentage of the fair market value that is determined by local assessors to be the total taxable value of land and additions on the property. | Land | Improvement |
|---|---|---|---|---|
| 2025 | $46 | $489,900 | $182,000 | $307,900 |
| 2024 | $4,223 | $457,500 | $182,000 | $275,500 |
| 2023 | $3,998 | $401,800 | $159,800 | $242,000 |
| 2022 | $3,770 | $368,900 | $148,700 | $220,200 |
| 2021 | $2,224 | $323,400 | $134,800 | $188,600 |
| 2020 | $3,577 | $323,400 | $134,800 | $188,600 |
| 2019 | $3,464 | $296,800 | $112,300 | $184,500 |
| 2018 | $3,316 | $282,200 | $107,100 | $175,100 |
| 2017 | $3,368 | $279,700 | $107,100 | $172,600 |
| 2016 | $3,303 | $271,200 | $107,100 | $164,100 |
| 2015 | $3,225 | $265,400 | $107,100 | $158,300 |
Source: Public Records
Map
Nearby Homes
- 32 Cedar St
- 32 Green St
- 2 Washburn Ave
- 11 Lawton St
- 24 Middle St
- 58 Washington St
- 0 Nulands Neck Unit 73286360
- 8 Washington St
- 145 Pleasant St
- 8 Manor Dr
- 58 Bayview Ave
- 27 Bayview Ave
- 181 Washington St
- 77 Adams St
- 39 Christian St
- 15 Bayview Ave
- 67 Bridge St
- 9 Abbott St
- 138 Main St Unit 13
- 9 Cleveland St
Your Personal Tour Guide
Ask me questions while you tour the home.