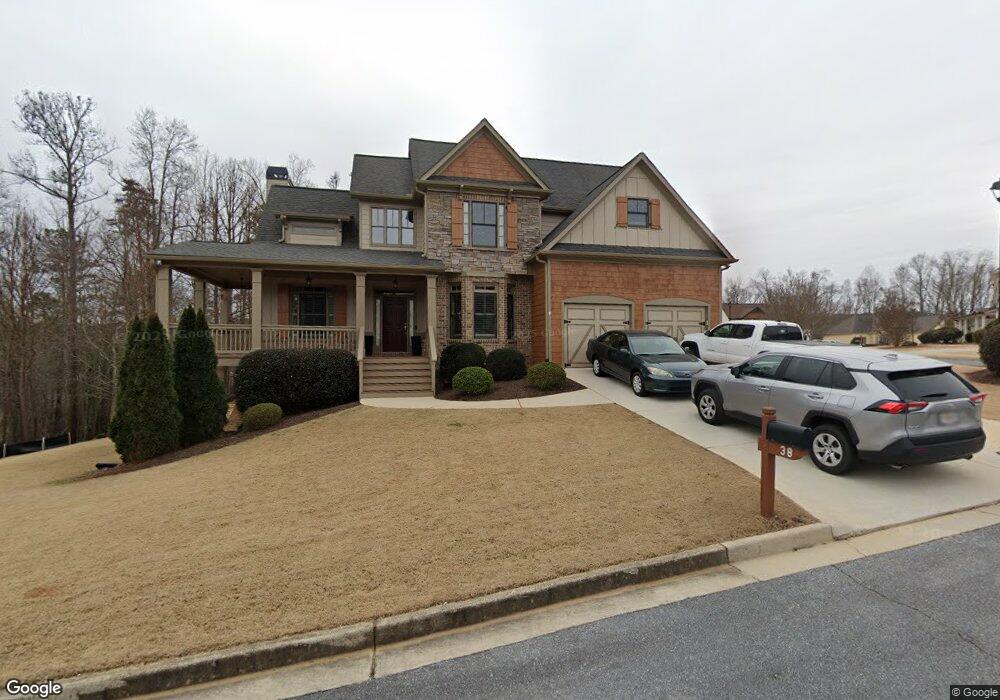
38 Pine Creek Ct Unit 3 Dallas, GA 30157
Cedarcrest NeighborhoodEstimated Value: $437,000 - $476,000
4
Beds
3
Baths
2,344
Sq Ft
$192/Sq Ft
Est. Value
About This Home
This home is located at 38 Pine Creek Ct Unit 3, Dallas, GA 30157 and is currently estimated at $450,936, approximately $192 per square foot. 38 Pine Creek Ct Unit 3 is a home located in Paulding County with nearby schools including Roland W. Russom Elementary School, East Paulding Middle School, and North Paulding High School.
Ownership History
Date
Name
Owned For
Owner Type
Purchase Details
Closed on
Mar 19, 2019
Sold by
Patrick Michael
Bought by
Dehaven Mark L and Dehaven Judy Lynn
Current Estimated Value
Purchase Details
Closed on
Jan 22, 2016
Sold by
Holzman Daniel
Bought by
Patrick Michael and Patrick Ann B
Home Financials for this Owner
Home Financials are based on the most recent Mortgage that was taken out on this home.
Original Mortgage
$184,100
Interest Rate
3.98%
Mortgage Type
New Conventional
Purchase Details
Closed on
Nov 30, 2007
Sold by
Stratland Ents Of Ga Inc
Bought by
Holzman Daniel and Holzman Lindsey
Home Financials for this Owner
Home Financials are based on the most recent Mortgage that was taken out on this home.
Original Mortgage
$225,625
Interest Rate
6.29%
Mortgage Type
New Conventional
Create a Home Valuation Report for This Property
The Home Valuation Report is an in-depth analysis detailing your home's value as well as a comparison with similar homes in the area
Home Values in the Area
Average Home Value in this Area
Purchase History
| Date | Buyer | Sale Price | Title Company |
|---|---|---|---|
| Dehaven Mark L | $278,500 | -- | |
| Patrick Michael | $263,000 | -- | |
| Holzman Daniel | $237,500 | -- |
Source: Public Records
Mortgage History
| Date | Status | Borrower | Loan Amount |
|---|---|---|---|
| Previous Owner | Patrick Michael | $184,100 | |
| Previous Owner | Holzman Daniel | $225,625 |
Source: Public Records
Tax History Compared to Growth
Tax History
| Year | Tax Paid | Tax Assessment Tax Assessment Total Assessment is a certain percentage of the fair market value that is determined by local assessors to be the total taxable value of land and additions on the property. | Land | Improvement |
|---|---|---|---|---|
| 2024 | $2,743 | $180,360 | $26,000 | $154,360 |
| 2023 | $2,913 | $177,480 | $26,000 | $151,480 |
| 2022 | $2,405 | $146,960 | $26,000 | $120,960 |
| 2021 | $3,375 | $118,000 | $26,000 | $92,000 |
| 2020 | $3,254 | $113,480 | $26,000 | $87,480 |
| 2019 | $3,126 | $103,760 | $26,000 | $77,760 |
| 2018 | $1,923 | $99,680 | $26,000 | $73,680 |
| 2017 | $3,011 | $100,440 | $26,000 | $74,440 |
| 2016 | $2,777 | $93,720 | $26,000 | $67,720 |
| 2015 | $2,516 | $83,600 | $14,000 | $69,600 |
| 2014 | $2,367 | $76,840 | $14,000 | $62,840 |
| 2013 | -- | $66,320 | $12,000 | $54,320 |
Source: Public Records
Map
Nearby Homes
- 75 Pine Creek Ct
- The Adams Plan at Timberlands Station
- 66 Pine Creek Ct Unit 73
- 200 Pine Trail
- 288 Pine Way
- 58 Pine Trail
- 612 Homestead Dr
- 373 Homestead Dr
- 454 Pine Bluff Dr
- 45 Homestead Dr
- 73 White Spruce Trail
- 20 Evergreen Way
- 36 Evergreen Way
- 75 S Cornucopia Bend
- 137 Cranberry Blossom Way
- 136 Four Seasons Blvd
- 116 Four Seasons Blvd
- 0 Dallas Acworth Hwy Unit 10624105
- 38 Pine Creek Ct
- 59 Pine Creek Ct
- 66 Pine Creek Ct
- 731 Pine Way
- 731 Pine Way Unit 731
- 708 Pine Way
- 708 Pine Way
- 794 Pine Way
- 37 Maple View Ct
- 75 Pine Creek Ct Unit LOT69,70,71,72,73
- 75 Pine Creek Ct Unit LOT69,70,71,72,73,18
- 827 Pine Way
- 83 Maple View Ct Unit 3
- 848 Pine Way
- 123 Maple View Ct
- 56 Maple View Ct
- 853 Pine Way
- 159 Maple View Ct Unit 3
- 84 Maple View Ct
- 638 Pine Way