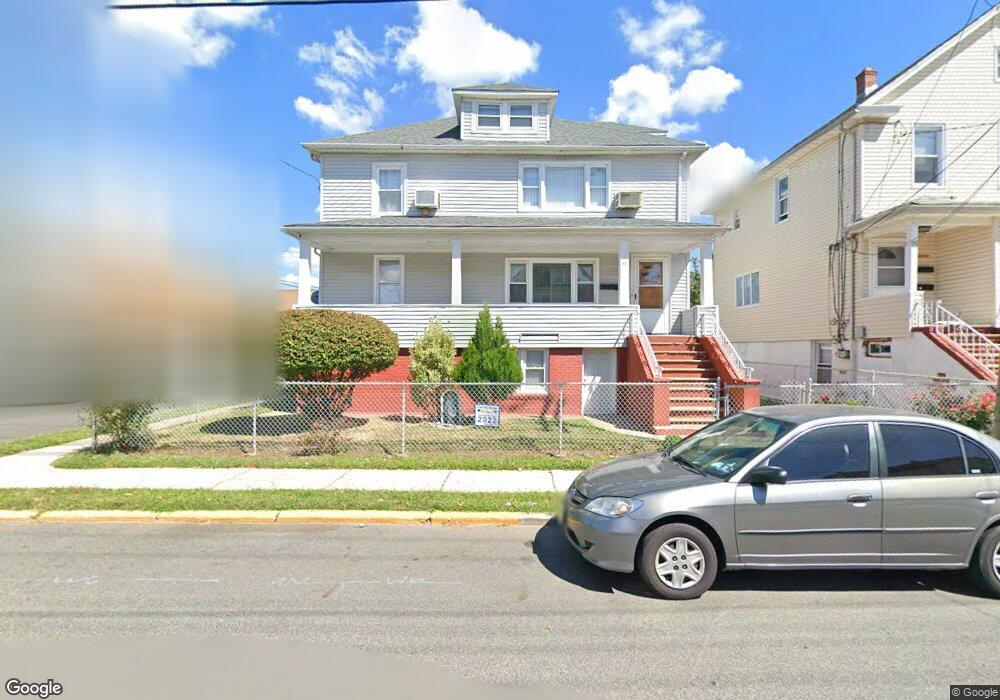
38 Pink St Hackensack, NJ 07601
Estimated Value: $580,000 - $892,000
Studio
--
Bath
1,768
Sq Ft
$403/Sq Ft
Est. Value
About This Home
This home is located at 38 Pink St, Hackensack, NJ 07601 and is currently estimated at $712,971, approximately $403 per square foot. 38 Pink St is a home located in Bergen County with nearby schools including Hackensack High School and George Washington School.
Ownership History
Date
Name
Owned For
Owner Type
Purchase Details
Closed on
Jul 21, 2012
Sold by
Santos Angel and Santos Juana
Bought by
Santos Angel and Santos Maria C
Current Estimated Value
Purchase Details
Closed on
Sep 30, 2005
Sold by
Dembow Brenda
Bought by
Santos Angel and Santos Juana
Home Financials for this Owner
Home Financials are based on the most recent Mortgage that was taken out on this home.
Original Mortgage
$392,000
Interest Rate
5.85%
Create a Home Valuation Report for This Property
The Home Valuation Report is an in-depth analysis detailing your home's value as well as a comparison with similar homes in the area
Home Values in the Area
Average Home Value in this Area
Purchase History
| Date | Buyer | Sale Price | Title Company |
|---|---|---|---|
| Santos Angel | $108,175 | -- | |
| Santos Angel | $490,000 | -- |
Source: Public Records
Mortgage History
| Date | Status | Borrower | Loan Amount |
|---|---|---|---|
| Previous Owner | Santos Angel | $392,000 |
Source: Public Records
Tax History
| Year | Tax Paid | Tax Assessment Tax Assessment Total Assessment is a certain percentage of the fair market value that is determined by local assessors to be the total taxable value of land and additions on the property. | Land | Improvement |
|---|---|---|---|---|
| 2025 | $12,429 | $406,700 | $147,300 | $259,400 |
| 2024 | $11,709 | $406,700 | $147,300 | $259,400 |
| 2023 | $11,149 | $406,700 | $147,300 | $259,400 |
| 2022 | $11,149 | $397,900 | $140,100 | $257,800 |
| 2021 | $11,085 | $330,100 | $125,400 | $204,700 |
| 2020 | $10,923 | $330,100 | $125,400 | $204,700 |
| 2019 | $10,907 | $324,900 | $123,500 | $201,400 |
| 2018 | $10,939 | $320,500 | $120,700 | $199,800 |
| 2017 | $10,771 | $315,400 | $118,800 | $196,600 |
| 2016 | $10,063 | $297,900 | $104,500 | $193,400 |
| 2015 | $10,308 | $294,500 | $140,000 | $154,500 |
| 2014 | $9,783 | $294,500 | $140,000 | $154,500 |
Source: Public Records
Map
Nearby Homes
- 222 Washington Ave
- 99 Kansas St
- 84 Kansas St
- 75 Cleveland St
- 113 Kansas St
- 115 Kansas St
- 337 Hudson St
- 9 Vreeland Ave Unit 3A
- 39 Union St Unit 105
- 418 Taylor Ave
- 115 River Rd
- 74 Union St
- 110 Sussex St Unit 2F
- 75 Union St Unit 5E
- 467 Hudson St
- 65 Mcdougall Ln
- 235 Larch Ave
- 72 Lawrence St
- 38 Chestnut Ave
- 115 Polifly Rd Unit 4F
Your Personal Tour Guide
Ask me questions while you tour the home.