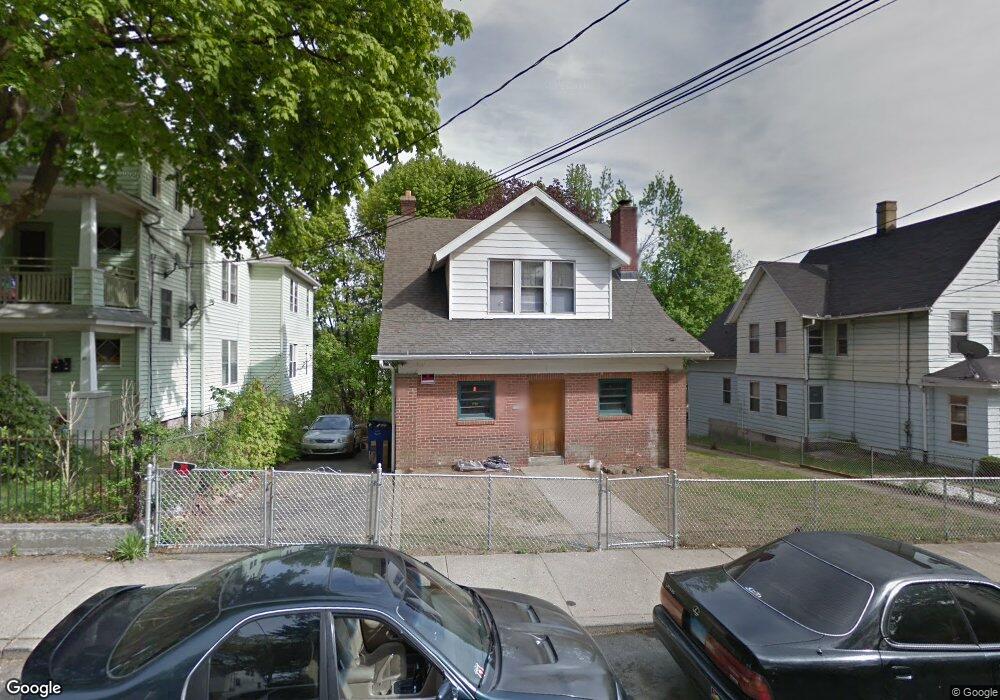
38 Platt St Waterbury, CT 06704
North End District NeighborhoodEstimated Value: $178,000 - $235,312
3
Beds
2
Baths
1,508
Sq Ft
$140/Sq Ft
Est. Value
About This Home
This home is located at 38 Platt St, Waterbury, CT 06704 and is currently estimated at $211,828, approximately $140 per square foot. 38 Platt St is a home located in New Haven County with nearby schools including Wilby High School, Alpha & Omega Christian Academy, and Mesivta Ateres Shmuel of Waterbury.
Ownership History
Date
Name
Owned For
Owner Type
Purchase Details
Closed on
Sep 19, 2018
Sold by
Campos Jose
Bought by
Campos Jose
Current Estimated Value
Home Financials for this Owner
Home Financials are based on the most recent Mortgage that was taken out on this home.
Original Mortgage
$71,250
Outstanding Balance
$62,006
Interest Rate
4.5%
Mortgage Type
New Conventional
Estimated Equity
$149,822
Purchase Details
Closed on
Feb 9, 1987
Sold by
Santopeitro J
Bought by
Lupacchino James
Home Financials for this Owner
Home Financials are based on the most recent Mortgage that was taken out on this home.
Original Mortgage
$78,300
Interest Rate
9.23%
Mortgage Type
Purchase Money Mortgage
Create a Home Valuation Report for This Property
The Home Valuation Report is an in-depth analysis detailing your home's value as well as a comparison with similar homes in the area
Home Values in the Area
Average Home Value in this Area
Purchase History
| Date | Buyer | Sale Price | Title Company |
|---|---|---|---|
| Campos Jose | $75,000 | -- | |
| Lupacchino James | $85,000 | -- |
Source: Public Records
Mortgage History
| Date | Status | Borrower | Loan Amount |
|---|---|---|---|
| Open | Lupacchino James | $71,250 | |
| Previous Owner | Lupacchino James | $78,300 |
Source: Public Records
Tax History Compared to Growth
Tax History
| Year | Tax Paid | Tax Assessment Tax Assessment Total Assessment is a certain percentage of the fair market value that is determined by local assessors to be the total taxable value of land and additions on the property. | Land | Improvement |
|---|---|---|---|---|
| 2025 | $3,438 | $76,440 | $12,670 | $63,770 |
| 2024 | $3,779 | $76,440 | $12,670 | $63,770 |
| 2023 | $4,142 | $76,440 | $12,670 | $63,770 |
| 2022 | $2,739 | $45,490 | $12,640 | $32,850 |
| 2021 | $2,739 | $45,490 | $12,640 | $32,850 |
| 2020 | $2,739 | $45,490 | $12,640 | $32,850 |
| 2019 | $2,739 | $45,490 | $12,640 | $32,850 |
| 2018 | $2,739 | $45,490 | $12,640 | $32,850 |
| 2017 | $2,587 | $42,960 | $12,640 | $30,320 |
| 2016 | $2,587 | $42,960 | $12,640 | $30,320 |
| 2015 | $2,501 | $42,960 | $12,640 | $30,320 |
| 2014 | $2,501 | $42,960 | $12,640 | $30,320 |
Source: Public Records
Map
Nearby Homes