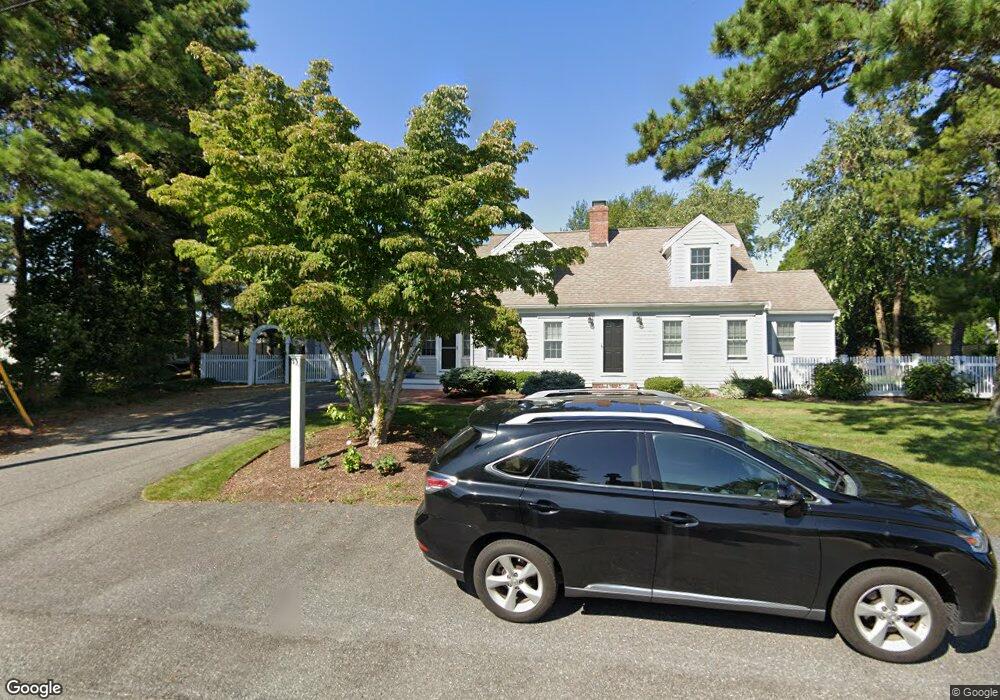
38 Porter Ln West Dennis, MA 02670
West Dennis NeighborhoodEstimated Value: $1,396,000 - $1,703,832
4
Beds
3
Baths
2,735
Sq Ft
$567/Sq Ft
Est. Value
About This Home
This home is located at 38 Porter Ln, West Dennis, MA 02670 and is currently estimated at $1,551,708, approximately $567 per square foot. 38 Porter Ln is a home located in Barnstable County with nearby schools including Dennis-Yarmouth Regional High School.
Ownership History
Date
Name
Owned For
Owner Type
Purchase Details
Closed on
Nov 22, 1991
Sold by
Symonds Richard N
Bought by
Hession Michael J and Hession Colleen A
Current Estimated Value
Home Financials for this Owner
Home Financials are based on the most recent Mortgage that was taken out on this home.
Original Mortgage
$100,000
Interest Rate
8.7%
Mortgage Type
Purchase Money Mortgage
Create a Home Valuation Report for This Property
The Home Valuation Report is an in-depth analysis detailing your home's value as well as a comparison with similar homes in the area
Home Values in the Area
Average Home Value in this Area
Purchase History
| Date | Buyer | Sale Price | Title Company |
|---|---|---|---|
| Hession Michael J | $180,000 | -- |
Source: Public Records
Mortgage History
| Date | Status | Borrower | Loan Amount |
|---|---|---|---|
| Open | Hession Michael J | $240,000 | |
| Closed | Hession Michael J | $100,000 |
Source: Public Records
Tax History Compared to Growth
Tax History
| Year | Tax Paid | Tax Assessment Tax Assessment Total Assessment is a certain percentage of the fair market value that is determined by local assessors to be the total taxable value of land and additions on the property. | Land | Improvement |
|---|---|---|---|---|
| 2025 | $6,770 | $1,563,400 | $562,000 | $1,001,400 |
| 2024 | $6,601 | $1,503,700 | $540,400 | $963,300 |
| 2023 | $6,385 | $1,367,200 | $491,300 | $875,900 |
| 2022 | $5,896 | $1,052,800 | $398,300 | $654,500 |
| 2021 | $5,553 | $920,900 | $390,500 | $530,400 |
| 2020 | $5,120 | $839,400 | $371,900 | $467,500 |
| 2019 | $4,781 | $774,900 | $364,600 | $410,300 |
| 2018 | $3,361 | $743,300 | $347,100 | $396,200 |
| 2017 | $4,571 | $743,300 | $347,100 | $396,200 |
| 2016 | $4,582 | $701,700 | $364,500 | $337,200 |
| 2015 | $4,491 | $701,700 | $364,500 | $337,200 |
| 2014 | $4,204 | $662,100 | $335,500 | $326,600 |
Source: Public Records
Map
Nearby Homes
- 2 Rita Mary Way
- 181 Pleasant St
- 308 Old Main St
- 14 Schoolhouse Ln
- 745 Willow St
- 209 Main St Unit 3
- 209 Main St Unit 6
- 209 Main St Unit 1
- 209 Main St Unit 2
- 209 Main St Unit 4
- 209 Main St Unit 5
- 40 Kelley Rd
- 45 Seth Ln
- 22 Powhatan Rd
- 178 School St
- 17 South St
- 23 Doric Ave
- 29 Bass River Rd
- 15 Sharon Rd
- 9 Victory Ln