J
Seller's Agent in 2013
Jill Napior
Tea Lane Associates
Estimated Value: $2,054,302 - $2,553,000
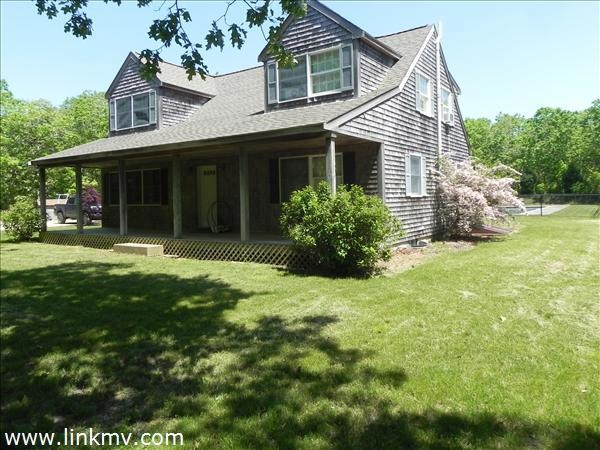
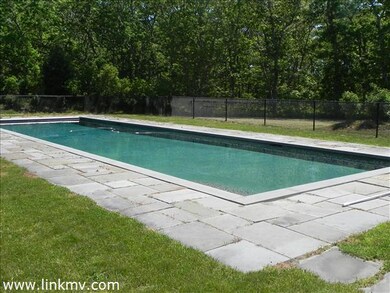
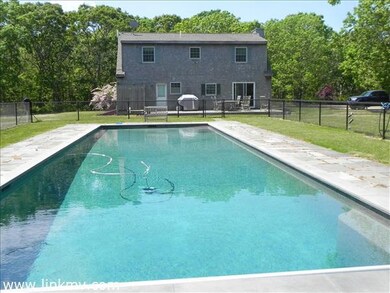
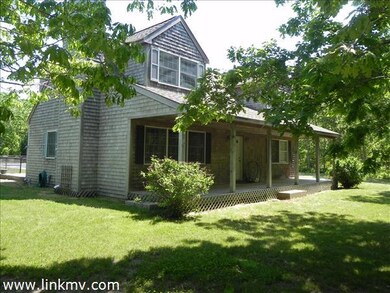
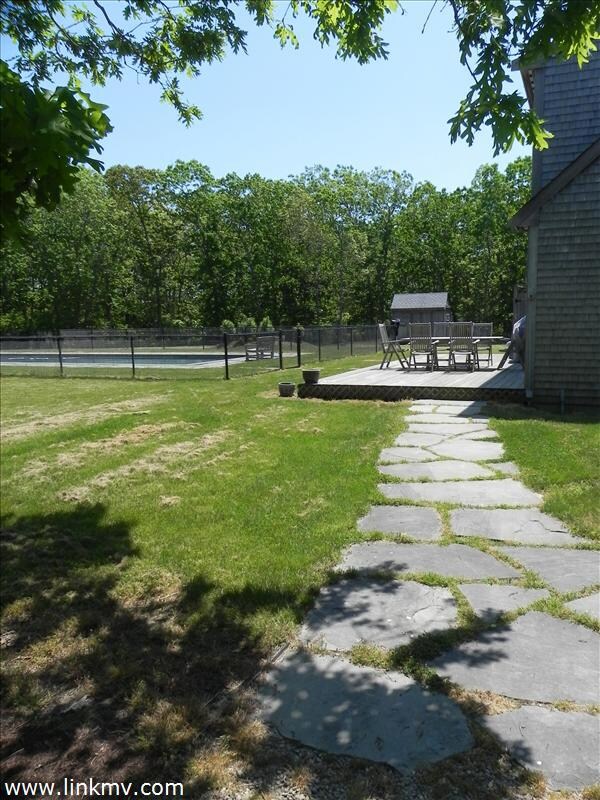
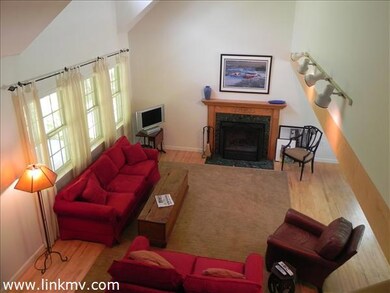
Easy and comfortable open floor plan with cathedral ceilings and a first floor master bedroom. Two bedrooms upstairs with a shared bath and separate office/living space. Full finished basement, very livable and well done. Large heated in ground gunite pool right off the deck for easy use . Well priced for Chilmark and nicely located for summer use (1 mile to Quansoo beach) or year round living (2 miles to Alleys General Store)
Last Agent to Sell the Property
Jill Napior
Tea Lane Associates Listed on: 11/04/2011
Last Buyer's Agent
Meg Bodnar
Tea Lane Associates
| Date | Buyer | Sale Price | Title Company |
|---|---|---|---|
| Caruso Michael T | $865,000 | -- | |
| Parkhurst Claire | $890,000 | -- | |
| Socha Stephen A | $121,000 | -- |
| Date | Status | Borrower | Loan Amount |
|---|---|---|---|
| Open | Socha Stephen A | $550,000 | |
| Previous Owner | Socha Stephen A | $667,500 | |
| Previous Owner | Socha Stephen A | $28,500 | |
| Previous Owner | Socha Stephen A | $27,500 |
| Date | Event | Price | List to Sale | Price per Sq Ft |
|---|---|---|---|---|
| 10/10/2013 10/10/13 | Sold | $865,000 | -33.2% | $281 / Sq Ft |
| 09/03/2013 09/03/13 | Pending | -- | -- | -- |
| 11/04/2011 11/04/11 | For Sale | $1,295,000 | -- | $420 / Sq Ft |
| Year | Tax Paid | Tax Assessment Tax Assessment Total Assessment is a certain percentage of the fair market value that is determined by local assessors to be the total taxable value of land and additions on the property. | Land | Improvement |
|---|---|---|---|---|
| 2025 | $3,445 | $1,531,200 | $941,700 | $589,500 |
| 2024 | $2,940 | $1,386,800 | $818,900 | $567,900 |
| 2023 | $2,733 | $1,039,300 | $629,900 | $409,400 |
| 2022 | $2,770 | $982,300 | $629,900 | $352,400 |
| 2021 | $2,738 | $940,800 | $629,900 | $310,900 |
| 2020 | $2,629 | $919,300 | $617,500 | $301,800 |
| 2019 | $2,600 | $902,700 | $617,500 | $285,200 |
| 2018 | $2,482 | $902,700 | $617,500 | $285,200 |
| 2017 | $2,413 | $900,400 | $617,500 | $282,900 |
| 2016 | $2,432 | $897,500 | $617,500 | $280,000 |
| 2015 | $2,426 | $922,500 | $617,500 | $305,000 |
| 2014 | $2,386 | $962,100 | $630,000 | $332,100 |
J
Seller's Agent in 2013
Jill Napior
Tea Lane Associates
M
Buyer's Agent in 2013
Meg Bodnar
Tea Lane Associates
Source: LINK (Vineyard)
MLS Number: 22200
APN: CHIL-000011-000028-000009
Ask me questions while you tour the home.