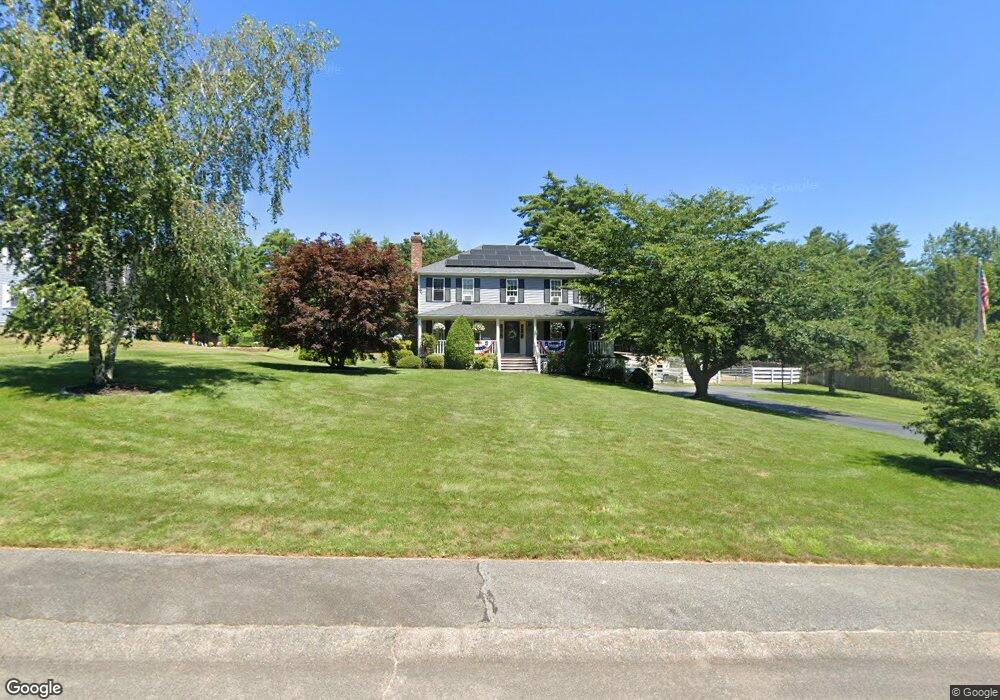
38 Priscilla Mullins Way Carver, MA 02330
Estimated Value: $682,000 - $846,000
4
Beds
3
Baths
2,144
Sq Ft
$347/Sq Ft
Est. Value
About This Home
This home is located at 38 Priscilla Mullins Way, Carver, MA 02330 and is currently estimated at $744,294, approximately $347 per square foot. 38 Priscilla Mullins Way is a home located in Plymouth County with nearby schools including Carver Elementary School.
Ownership History
Date
Name
Owned For
Owner Type
Purchase Details
Closed on
Jun 4, 2009
Sold by
Tardy Kathleen
Bought by
Tardy Kathleen D and Tardy Steven J
Current Estimated Value
Home Financials for this Owner
Home Financials are based on the most recent Mortgage that was taken out on this home.
Original Mortgage
$281,000
Outstanding Balance
$178,113
Interest Rate
4.83%
Mortgage Type
Purchase Money Mortgage
Estimated Equity
$566,181
Purchase Details
Closed on
Nov 29, 2004
Sold by
Tardy Kathleen and Dugan Kathleen E
Bought by
Tardy Kathleen
Home Financials for this Owner
Home Financials are based on the most recent Mortgage that was taken out on this home.
Original Mortgage
$241,000
Interest Rate
5.75%
Mortgage Type
Purchase Money Mortgage
Purchase Details
Closed on
Jul 2, 1999
Sold by
Standish Group
Bought by
Whitney Hugh F and Whitney Kathleen E
Create a Home Valuation Report for This Property
The Home Valuation Report is an in-depth analysis detailing your home's value as well as a comparison with similar homes in the area
Home Values in the Area
Average Home Value in this Area
Purchase History
| Date | Buyer | Sale Price | Title Company |
|---|---|---|---|
| Tardy Kathleen D | -- | -- | |
| Tardy Kathleen | -- | -- | |
| Whitney Hugh F | $219,900 | -- |
Source: Public Records
Mortgage History
| Date | Status | Borrower | Loan Amount |
|---|---|---|---|
| Open | Whitney Hugh F | $281,000 | |
| Previous Owner | Whitney Hugh F | $89,400 | |
| Previous Owner | Whitney Hugh F | $241,000 | |
| Previous Owner | Whitney Hugh F | $30,000 |
Source: Public Records
Tax History Compared to Growth
Tax History
| Year | Tax Paid | Tax Assessment Tax Assessment Total Assessment is a certain percentage of the fair market value that is determined by local assessors to be the total taxable value of land and additions on the property. | Land | Improvement |
|---|---|---|---|---|
| 2025 | $8,587 | $619,100 | $154,900 | $464,200 |
| 2024 | $7,857 | $554,500 | $151,900 | $402,600 |
| 2023 | $7,559 | $518,100 | $151,900 | $366,200 |
| 2022 | $7,212 | $451,300 | $129,900 | $321,400 |
| 2021 | $6,898 | $407,200 | $116,000 | $291,200 |
| 2020 | $6,637 | $386,100 | $108,400 | $277,700 |
| 2019 | $6,406 | $375,700 | $105,200 | $270,500 |
| 2018 | $6,213 | $352,400 | $105,200 | $247,200 |
| 2017 | $5,953 | $336,500 | $101,200 | $235,300 |
| 2016 | $5,531 | $324,800 | $96,400 | $228,400 |
| 2015 | $5,353 | $314,700 | $96,400 | $218,300 |
| 2014 | $5,232 | $307,600 | $121,900 | $185,700 |
Source: Public Records
Map
Nearby Homes
- 28 Washington Park
- 5 Presidents Way
- 29 Pipers Way
- 6 Jefferson Way
- 210 Tremont St
- 19 Pine Ridge Way
- Lot 1 Ohana Way
- 5 Ohana Way
- Lot 2 Ohana Way
- 28 Wareham St
- 38 Copper Lantern Ln
- 23 Marks Way
- 5 Marks Way
- 3 Rochester Rd
- 29 Wyndemere Ct
- 29 S Meadow Village
- 22 S Meadow Village
- 9 Everett St
- 48 S Meadow Village
- 235 Main St
- 40 Priscilla Mullins Way
- 36 Priscilla Mullins Way
- 42 Priscilla Mullins Way
- 34 Priscilla Mullins Way
- 39 Priscilla Mullins Way
- 33 Priscilla Mullins Way
- 41 Priscilla Mullins Way
- 32 Priscilla Mullins Way
- 5 Brewster Ave
- 43 Priscilla Mullins Way
- 30 Priscilla Mullins Way
- 29 Priscilla Mullins Way
- 28 Priscilla Mullins Way
- 3 Brewster Ave
- 116 Priscilla Mullins Way
- 70 Priscilla Mullins Way
- 38 Myles Standish Dr
- 6 Brewster Ave
- 27 Priscilla Mullins Way
- 40 Myles Standish Dr