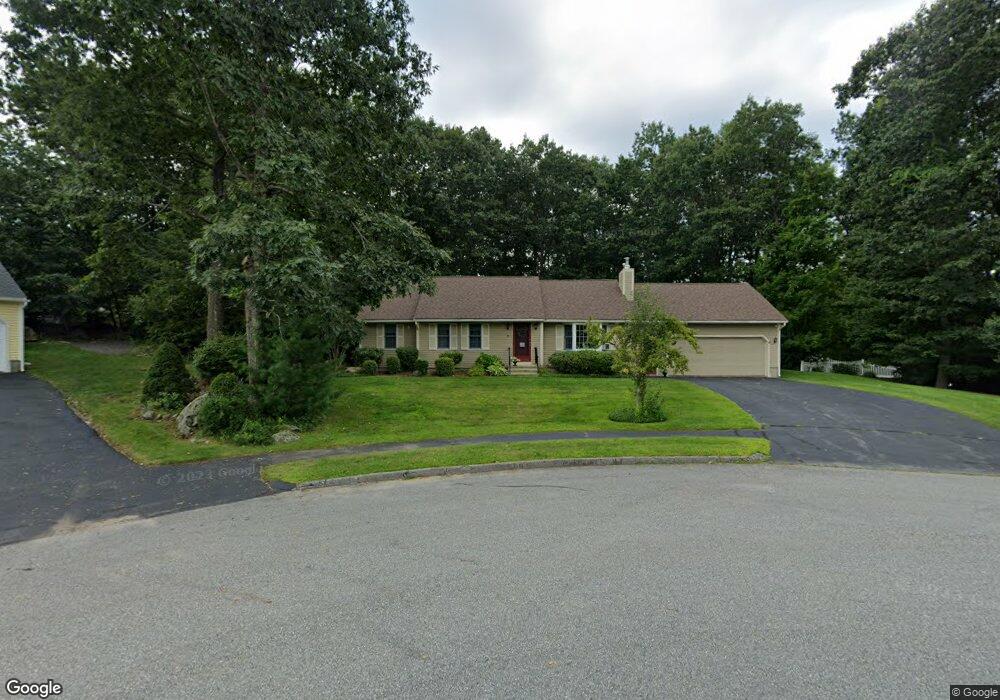
38 Quail Run Holden, MA 01520
Estimated Value: $556,000 - $587,000
3
Beds
2
Baths
1,318
Sq Ft
$435/Sq Ft
Est. Value
About This Home
This home is located at 38 Quail Run, Holden, MA 01520 and is currently estimated at $572,772, approximately $434 per square foot. 38 Quail Run is a home located in Worcester County with nearby schools including Wachusett Regional High School, Abby Kelley Foster Charter Public School, and Bancroft School.
Ownership History
Date
Name
Owned For
Owner Type
Purchase Details
Closed on
Mar 2, 2020
Sold by
Jardus Sara A
Bought by
John & Elizabeth Hanlon Lt
Current Estimated Value
Purchase Details
Closed on
Feb 4, 2005
Sold by
Hanlon Elizabeth A and Hanlon John J
Bought by
Hanlon John and Hanlon Elizabeth
Purchase Details
Closed on
Jun 21, 1995
Sold by
Lind Sharon
Bought by
Hanlon John and Hanlon Elizabeth
Create a Home Valuation Report for This Property
The Home Valuation Report is an in-depth analysis detailing your home's value as well as a comparison with similar homes in the area
Home Values in the Area
Average Home Value in this Area
Purchase History
| Date | Buyer | Sale Price | Title Company |
|---|---|---|---|
| John & Elizabeth Hanlon Lt | -- | None Available | |
| Jardus Sara A | -- | None Available | |
| Hanlon John | -- | -- | |
| Hanlon John | $7,500 | -- |
Source: Public Records
Tax History
| Year | Tax Paid | Tax Assessment Tax Assessment Total Assessment is a certain percentage of the fair market value that is determined by local assessors to be the total taxable value of land and additions on the property. | Land | Improvement |
|---|---|---|---|---|
| 2025 | $7,839 | $565,600 | $216,300 | $349,300 |
| 2024 | $7,471 | $528,000 | $210,100 | $317,900 |
| 2023 | $7,489 | $499,600 | $182,500 | $317,100 |
| 2022 | $7,268 | $438,900 | $142,500 | $296,400 |
| 2021 | $7,016 | $403,200 | $135,700 | $267,500 |
| 2020 | $6,469 | $380,500 | $129,500 | $251,000 |
| 2019 | $6,350 | $363,900 | $129,500 | $234,400 |
| 2018 | $3,470 | $341,300 | $123,200 | $218,100 |
| 2017 | $5,856 | $332,900 | $123,200 | $209,700 |
| 2016 | $5,498 | $318,700 | $117,500 | $201,200 |
| 2015 | $5,624 | $310,400 | $117,500 | $192,900 |
| 2014 | $5,510 | $310,400 | $117,500 | $192,900 |
Source: Public Records
Map
Nearby Homes
- 3 Torrey Ln
- 23 Leslie Rd
- 42 N Worcester Ave
- 158 Chester St
- 5 Piehl Ave
- 90 Bjorklund Ave
- 23 Gail Dr
- 84 Chester St
- 4004 Brompton Cir
- 527 Salisbury St
- 270 Brattle St
- 61 Barry Rd
- 46 Barry Rd
- 770 Salisbury St Unit 517
- 770 Salisbury St Unit 333
- 97 Parkton Ave
- 16 Sycamore Dr
- 146 Shrewsbury St
- 250 Shrewsbury St
- 37 Mohave Rd
Your Personal Tour Guide
Ask me questions while you tour the home.