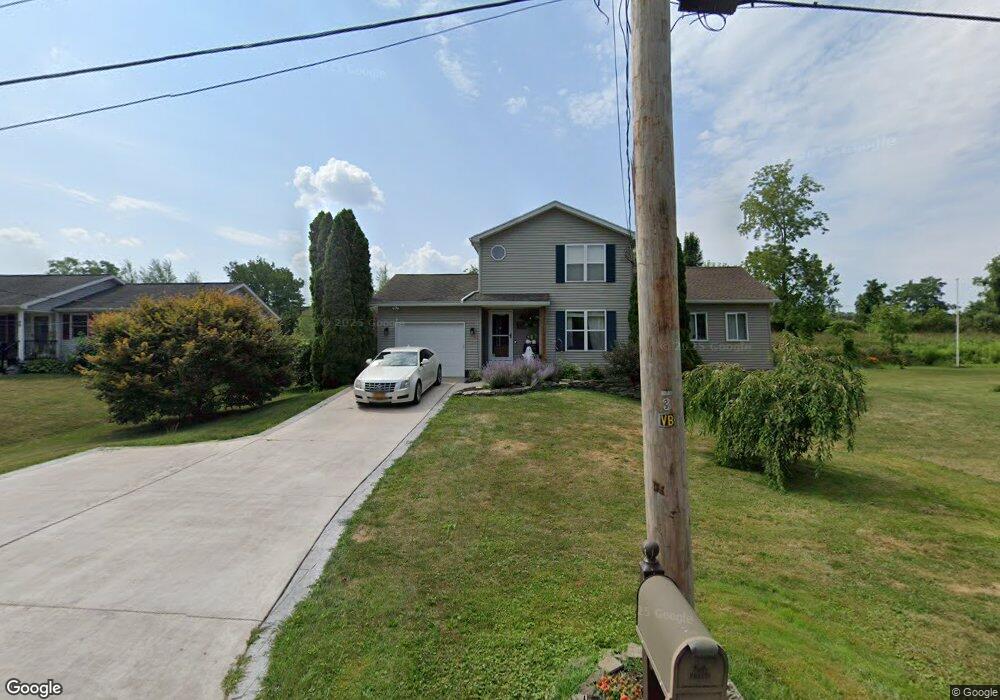
38 Quarry St Brockport, NY 14420
Estimated Value: $247,000 - $270,044
3
Beds
2
Baths
1,104
Sq Ft
$238/Sq Ft
Est. Value
About This Home
This home is located at 38 Quarry St, Brockport, NY 14420 and is currently estimated at $262,511, approximately $237 per square foot. 38 Quarry St is a home located in Monroe County with nearby schools including Ginther Elementary School, Barclay Elementary School, and Fred W. Hill Elementary School.
Ownership History
Date
Name
Owned For
Owner Type
Purchase Details
Closed on
Dec 29, 2010
Sold by
Marciniak Daniel
Bought by
Butlin Cody and Butlin Loni
Current Estimated Value
Home Financials for this Owner
Home Financials are based on the most recent Mortgage that was taken out on this home.
Original Mortgage
$113,387
Outstanding Balance
$75,318
Interest Rate
4.25%
Mortgage Type
FHA
Estimated Equity
$187,193
Purchase Details
Closed on
Jun 17, 2007
Sold by
Gerling Charles R
Bought by
Marciniak Daniel
Home Financials for this Owner
Home Financials are based on the most recent Mortgage that was taken out on this home.
Original Mortgage
$105,325
Interest Rate
6.24%
Mortgage Type
New Conventional
Create a Home Valuation Report for This Property
The Home Valuation Report is an in-depth analysis detailing your home's value as well as a comparison with similar homes in the area
Home Values in the Area
Average Home Value in this Area
Purchase History
| Date | Buyer | Sale Price | Title Company |
|---|---|---|---|
| Butlin Cody | $117,500 | None Available | |
| Marciniak Daniel | $105,325 | Timothy Mccusker |
Source: Public Records
Mortgage History
| Date | Status | Borrower | Loan Amount |
|---|---|---|---|
| Open | Butlin Cody | $113,387 | |
| Previous Owner | Marciniak Daniel | $105,325 |
Source: Public Records
Tax History Compared to Growth
Tax History
| Year | Tax Paid | Tax Assessment Tax Assessment Total Assessment is a certain percentage of the fair market value that is determined by local assessors to be the total taxable value of land and additions on the property. | Land | Improvement |
|---|---|---|---|---|
| 2024 | $8,131 | $227,200 | $28,100 | $199,100 |
| 2023 | $7,554 | $181,600 | $20,700 | $160,900 |
| 2022 | $6,005 | $181,600 | $20,700 | $160,900 |
| 2021 | $5,974 | $124,200 | $18,600 | $105,600 |
| 2020 | $5,150 | $124,200 | $18,600 | $105,600 |
| 2019 | $3,701 | $110,800 | $18,600 | $92,200 |
| 2018 | $4,933 | $110,800 | $18,600 | $92,200 |
| 2017 | $2,018 | $112,500 | $20,700 | $91,800 |
| 2016 | $3,701 | $112,500 | $20,700 | $91,800 |
Source: Public Records
Map
Nearby Homes