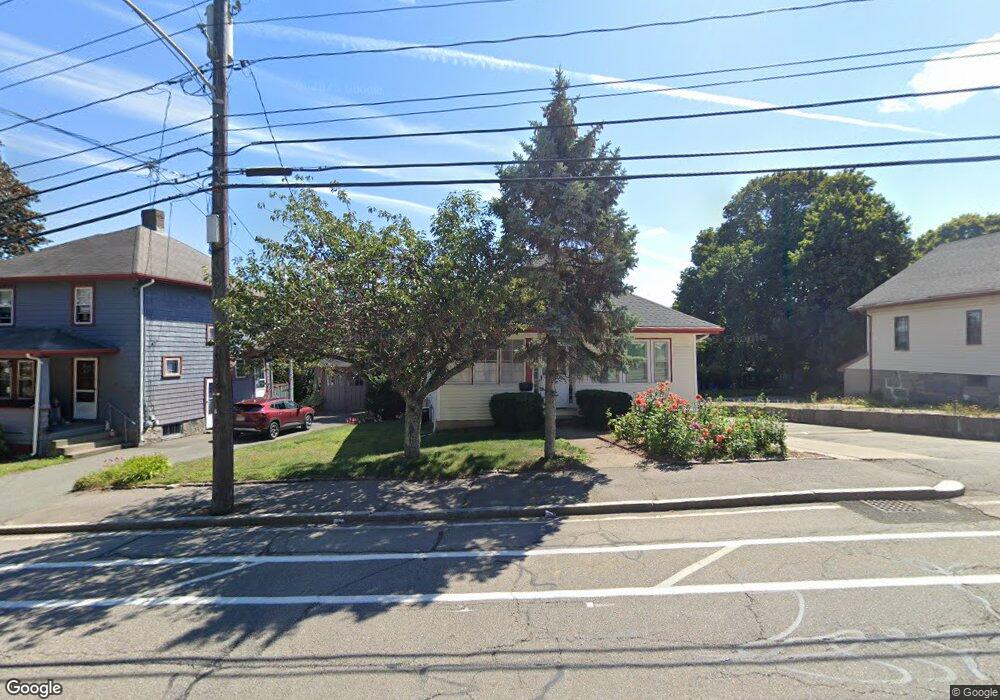
38 Quarry St Quincy, MA 02169
South Quincy NeighborhoodEstimated Value: $551,000 - $607,000
2
Beds
2
Baths
1,243
Sq Ft
$467/Sq Ft
Est. Value
About This Home
This home is located at 38 Quarry St, Quincy, MA 02169 and is currently estimated at $580,451, approximately $466 per square foot. 38 Quarry St is a home located in Norfolk County with nearby schools including Lincoln-Hancock Community School, South West Middle School, and Quincy High School.
Ownership History
Date
Name
Owned For
Owner Type
Purchase Details
Closed on
Dec 21, 1998
Sold by
Nota Sharon L
Bought by
Wen Herman
Current Estimated Value
Home Financials for this Owner
Home Financials are based on the most recent Mortgage that was taken out on this home.
Original Mortgage
$80,000
Outstanding Balance
$18,282
Interest Rate
6.85%
Mortgage Type
Purchase Money Mortgage
Estimated Equity
$562,169
Create a Home Valuation Report for This Property
The Home Valuation Report is an in-depth analysis detailing your home's value as well as a comparison with similar homes in the area
Home Values in the Area
Average Home Value in this Area
Purchase History
| Date | Buyer | Sale Price | Title Company |
|---|---|---|---|
| Wen Herman | $156,000 | -- |
Source: Public Records
Mortgage History
| Date | Status | Borrower | Loan Amount |
|---|---|---|---|
| Open | Wen Herman | $80,000 |
Source: Public Records
Tax History Compared to Growth
Tax History
| Year | Tax Paid | Tax Assessment Tax Assessment Total Assessment is a certain percentage of the fair market value that is determined by local assessors to be the total taxable value of land and additions on the property. | Land | Improvement |
|---|---|---|---|---|
| 2025 | $5,605 | $486,100 | $265,000 | $221,100 |
| 2024 | $5,252 | $466,000 | $252,400 | $213,600 |
| 2023 | $4,955 | $445,200 | $229,400 | $215,800 |
| 2022 | $5,009 | $418,100 | $208,600 | $209,500 |
| 2021 | $4,924 | $405,600 | $208,600 | $197,000 |
| 2020 | $4,705 | $378,500 | $198,600 | $179,900 |
| 2019 | $4,464 | $355,700 | $187,400 | $168,300 |
| 2018 | $4,573 | $342,800 | $187,400 | $155,400 |
| 2017 | $4,472 | $315,600 | $178,500 | $137,100 |
| 2016 | $4,295 | $299,100 | $170,000 | $129,100 |
| 2015 | $4,173 | $285,800 | $170,000 | $115,800 |
| 2014 | $4,121 | $277,300 | $161,900 | $115,400 |
Source: Public Records
Map
Nearby Homes
- 64 Garfield St Unit B
- 91 Garfield St
- 76 Scotch Pond Place Unit 76
- 51 Brook Rd
- 73 Scotch Pond Place
- 21 Arthur St
- 12 Arthur Ave
- 94 Brook Rd Unit 3
- 14 Arthur Ave
- 118 Brook Rd Unit 2
- 46 Suomi Rd
- 46 Suomi Rd Unit 46
- 8 Jackson St Unit B2
- 46-48 Buckley St
- 57 Buckley St
- 1 Cityview Ln Unit 506
- 1 Cityview Ln Unit 709
- 56 Penn St Unit 4
- 50 N Payne St Unit 1
- 50 N Payne St Unit 3
- 40 Quarry St
- 30 Quarry St
- 42 Quarry St Unit 1
- 42 Quarry St
- 44 Quarry St Unit 2
- 19 Garfield St
- 19 Garfield St Unit 1
- 21 Garfield St Unit 2
- 15 Garfield St
- 23 Garfield St
- 20 Quarry St
- 20 Quarry St Unit 3
- 46 Quarry St
- 46 Quarry St Unit 1
- 46 Quarry St Unit A
- 46 Quarry St Unit C
- 46 Quarry St Unit B
- 46 Quarry St Unit 2
- 46 Quarry St Unit A3
- 46 Quarry St Unit 1-3