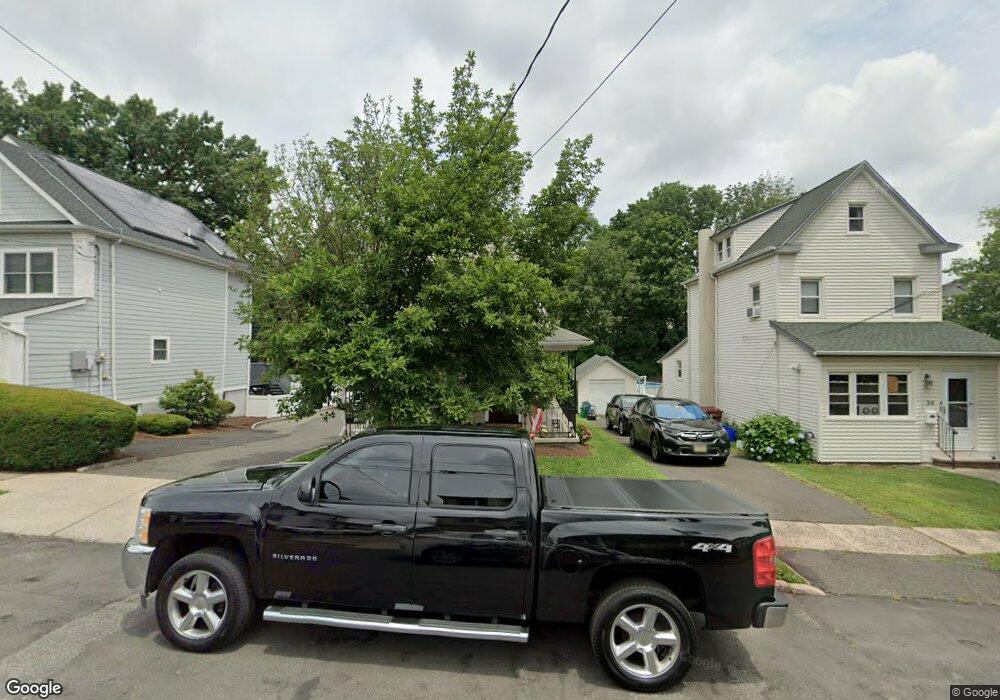
38 Race St Unit 2nd Floor Nutley, NJ 07110
Estimated Value: $688,750 - $926,000
2
Beds
1
Bath
1,876
Sq Ft
$402/Sq Ft
Est. Value
About This Home
This home is located at 38 Race St Unit 2nd Floor, Nutley, NJ 07110 and is currently estimated at $754,688, approximately $402 per square foot. 38 Race St Unit 2nd Floor is a home located in Essex County with nearby schools including Nutley High School and Good Shepherd Academy.
Ownership History
Date
Name
Owned For
Owner Type
Purchase Details
Closed on
Apr 7, 2017
Sold by
Sposato Angelo M
Bought by
Tortora Daniel and Tortora Alyssia
Current Estimated Value
Home Financials for this Owner
Home Financials are based on the most recent Mortgage that was taken out on this home.
Original Mortgage
$381,562
Outstanding Balance
$318,897
Interest Rate
4.37%
Mortgage Type
FHA
Estimated Equity
$435,791
Create a Home Valuation Report for This Property
The Home Valuation Report is an in-depth analysis detailing your home's value as well as a comparison with similar homes in the area
Home Values in the Area
Average Home Value in this Area
Purchase History
| Date | Buyer | Sale Price | Title Company |
|---|---|---|---|
| Tortora Daniel | $403,000 | None Available |
Source: Public Records
Mortgage History
| Date | Status | Borrower | Loan Amount |
|---|---|---|---|
| Open | Tortora Daniel | $381,562 |
Source: Public Records
Tax History Compared to Growth
Tax History
| Year | Tax Paid | Tax Assessment Tax Assessment Total Assessment is a certain percentage of the fair market value that is determined by local assessors to be the total taxable value of land and additions on the property. | Land | Improvement |
|---|---|---|---|---|
| 2025 | $13,148 | $487,000 | $212,500 | $274,500 |
| 2024 | $13,148 | $487,000 | $212,500 | $274,500 |
| 2022 | $10,711 | $277,200 | $112,500 | $164,700 |
| 2021 | $10,656 | $277,200 | $112,500 | $164,700 |
| 2020 | $10,207 | $277,200 | $112,500 | $164,700 |
| 2019 | $10,001 | $277,200 | $112,500 | $164,700 |
| 2018 | $9,732 | $277,200 | $112,500 | $164,700 |
| 2017 | $9,537 | $274,600 | $112,500 | $162,100 |
| 2016 | $9,254 | $274,600 | $112,500 | $162,100 |
| 2015 | $9,106 | $274,600 | $112,500 | $162,100 |
| 2014 | $8,990 | $274,600 | $112,500 | $162,100 |
Source: Public Records
Map
Nearby Homes