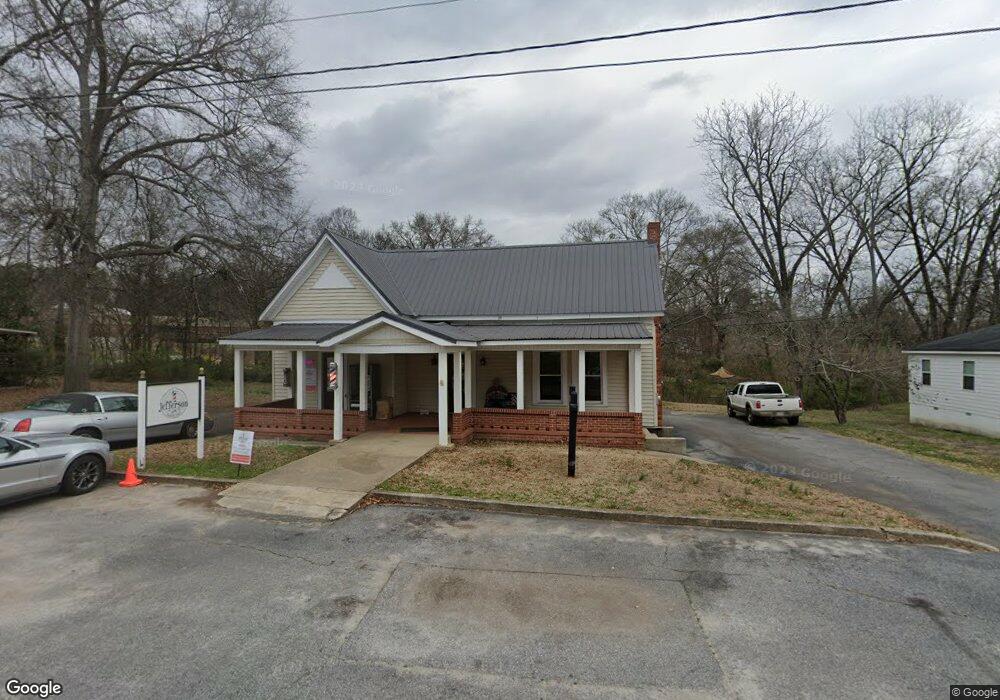
38 Railroad Ave Jefferson, GA 30549
Estimated Value: $154,000 - $352,000
--
Bed
2
Baths
1,376
Sq Ft
$202/Sq Ft
Est. Value
About This Home
This home is located at 38 Railroad Ave, Jefferson, GA 30549 and is currently estimated at $277,924, approximately $201 per square foot. 38 Railroad Ave is a home with nearby schools including Jefferson Elementary School, Jefferson Academy, and Jefferson Middle School.
Ownership History
Date
Name
Owned For
Owner Type
Purchase Details
Closed on
Sep 28, 2018
Sold by
Horn Properties Of Georgia Llc
Bought by
Tmd Investments Llc
Current Estimated Value
Purchase Details
Closed on
Apr 24, 2013
Sold by
Hanley Jerry
Bought by
Horn Properties Of Georgia Llc
Create a Home Valuation Report for This Property
The Home Valuation Report is an in-depth analysis detailing your home's value as well as a comparison with similar homes in the area
Home Values in the Area
Average Home Value in this Area
Purchase History
| Date | Buyer | Sale Price | Title Company |
|---|---|---|---|
| Tmd Investments Llc | $180,000 | -- | |
| Horn Properties Of Georgia Llc | $77,600 | -- |
Source: Public Records
Mortgage History
| Date | Status | Borrower | Loan Amount |
|---|---|---|---|
| Closed | Horn Properties Of Georgia Llc | $0 |
Source: Public Records
Tax History Compared to Growth
Tax History
| Year | Tax Paid | Tax Assessment Tax Assessment Total Assessment is a certain percentage of the fair market value that is determined by local assessors to be the total taxable value of land and additions on the property. | Land | Improvement |
|---|---|---|---|---|
| 2024 | $3,093 | $112,680 | $40,280 | $72,400 |
| 2023 | $3,106 | $102,720 | $40,280 | $62,440 |
| 2022 | $2,601 | $80,920 | $32,200 | $48,720 |
| 2021 | $2,649 | $80,920 | $32,200 | $48,720 |
| 2020 | $2,026 | $57,840 | $25,760 | $32,080 |
| 2019 | $2,057 | $57,840 | $25,760 | $32,080 |
| 2018 | $1,666 | $46,480 | $19,320 | $27,160 |
| 2017 | $1,610 | $44,023 | $19,340 | $24,683 |
| 2016 | $1,618 | $44,023 | $19,340 | $24,683 |
| 2015 | $1,039 | $28,162 | $3,479 | $24,683 |
| 2014 | $1,064 | $28,564 | $3,479 | $25,085 |
| 2013 | -- | $27,408 | $3,446 | $23,961 |
Source: Public Records
Map
Nearby Homes
- 0 Georgia 82 N
- 284 Oak St
- 107 Church St
- 131 Martin Luther King jr Dr
- 0 Curry Dr Unit LOT 30
- 0 Curry Dr Unit 7665673
- 0 Curry Dr Unit 7666260
- 0 Curry Dr Unit LOT 6
- 0 Curry Dr Unit LOT 14
- 0 Curry Dr Unit LOT 32
- 0 Curry Dr Unit 7665753
- 0 Curry Dr Unit LOT 31
- 0 Curry Dr Unit 7666653
- 0 Curry Dr Unit LOT 13
- 0 Curry Dr Unit LOT 36
- 0 Curry Dr Unit LOT 35
- 0 Curry Dr Unit 7665736
- 0 Curry Dr Unit 7666371
- 0 Curry Dr Unit LOT 29
- 0 Curry Dr Unit 7665727