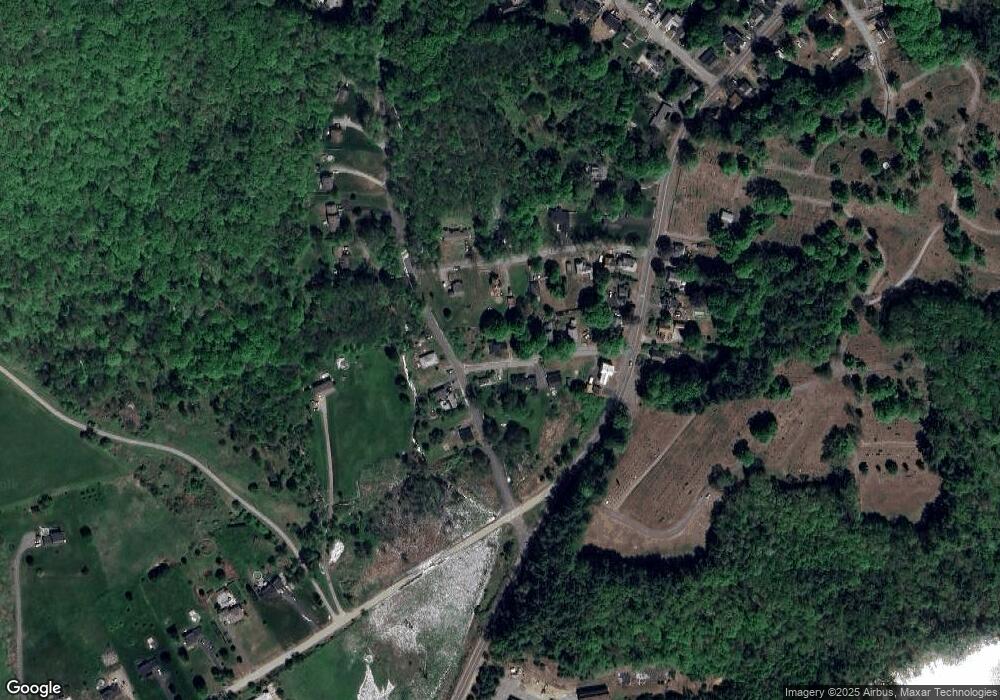
38 Ramsdell St Warren, MA 01083
Estimated Value: $282,000 - $300,000
3
Beds
2
Baths
1,500
Sq Ft
$194/Sq Ft
Est. Value
About This Home
This home is located at 38 Ramsdell St, Warren, MA 01083 and is currently estimated at $290,673, approximately $193 per square foot. 38 Ramsdell St is a home with nearby schools including Quaboag Regional High School.
Ownership History
Date
Name
Owned For
Owner Type
Purchase Details
Closed on
Nov 19, 2018
Sold by
Avinoam April M
Bought by
Flores Karla
Current Estimated Value
Purchase Details
Closed on
Nov 15, 2017
Sold by
Department Of Housing & Urban Dev
Bought by
Avinoam April M
Purchase Details
Closed on
Mar 29, 2017
Sold by
Bank Of America Na
Bought by
Department Of Housing & Urban Dev
Purchase Details
Closed on
Oct 31, 2016
Sold by
Delaney Jane F and Bank Of America Na
Bought by
Bank Of America Na
Purchase Details
Closed on
Nov 12, 1997
Sold by
Delaney Ina M
Bought by
Delaney Jane F and Dionne Marjorie R
Create a Home Valuation Report for This Property
The Home Valuation Report is an in-depth analysis detailing your home's value as well as a comparison with similar homes in the area
Home Values in the Area
Average Home Value in this Area
Purchase History
| Date | Buyer | Sale Price | Title Company |
|---|---|---|---|
| Flores Karla | $165,000 | -- | |
| Avinoam April M | $50,000 | -- | |
| Department Of Housing & Urban Dev | -- | -- | |
| Bank Of America Na | $211,755 | -- | |
| Delaney Jane F | $81,000 | -- | |
| Avinoam April M | $50,000 | -- | |
| Department Of Housing & Urban Dev | -- | -- | |
| Bank Of America Na | $211,755 | -- | |
| Delaney Jane F | $81,000 | -- |
Source: Public Records
Mortgage History
| Date | Status | Borrower | Loan Amount |
|---|---|---|---|
| Previous Owner | Delaney Jane F | $91,000 | |
| Previous Owner | Delaney Jane F | $80,900 |
Source: Public Records
Tax History Compared to Growth
Tax History
| Year | Tax Paid | Tax Assessment Tax Assessment Total Assessment is a certain percentage of the fair market value that is determined by local assessors to be the total taxable value of land and additions on the property. | Land | Improvement |
|---|---|---|---|---|
| 2025 | $3,011 | $203,300 | $50,100 | $153,200 |
| 2024 | $2,871 | $190,500 | $50,100 | $140,400 |
| 2023 | $3,010 | $190,500 | $50,100 | $140,400 |
| 2022 | $2,647 | $170,100 | $41,200 | $128,900 |
| 2021 | $2,589 | $162,200 | $39,000 | $123,200 |
| 2020 | $2,564 | $149,400 | $39,000 | $110,400 |
| 2019 | $2,575 | $141,900 | $39,000 | $102,900 |
| 2018 | $2,269 | $131,000 | $39,000 | $92,000 |
| 2017 | $2,359 | $127,100 | $40,500 | $86,600 |
| 2016 | $2,413 | $121,600 | $38,600 | $83,000 |
| 2015 | $2,183 | $116,400 | $38,600 | $77,800 |
| 2014 | $2,277 | $119,200 | $38,600 | $80,600 |
Source: Public Records
Map
Nearby Homes
- 170 Bridge St
- Lot 5 Brimfield Rd
- Lot 3 Brimfield Rd
- 59 High St
- Lot 7 Reed St
- 82 Comins Pond Rd
- Lot 4 Brimfield Rd
- Lot 8 Southbridge Rd
- LOT 7 Southbridge Rd
- 29 Bacon St
- 35 Bacon St
- 366 Southbridge Rd
- 111 Quaboag St
- 17 Otis St
- 29 Liberty St
- 0 Town Farm Rd
- Lot 3C Crouch Rd
- 95 Town Farm Rd
- 235 Crouch Rd
- 77 O'Neil Rd
