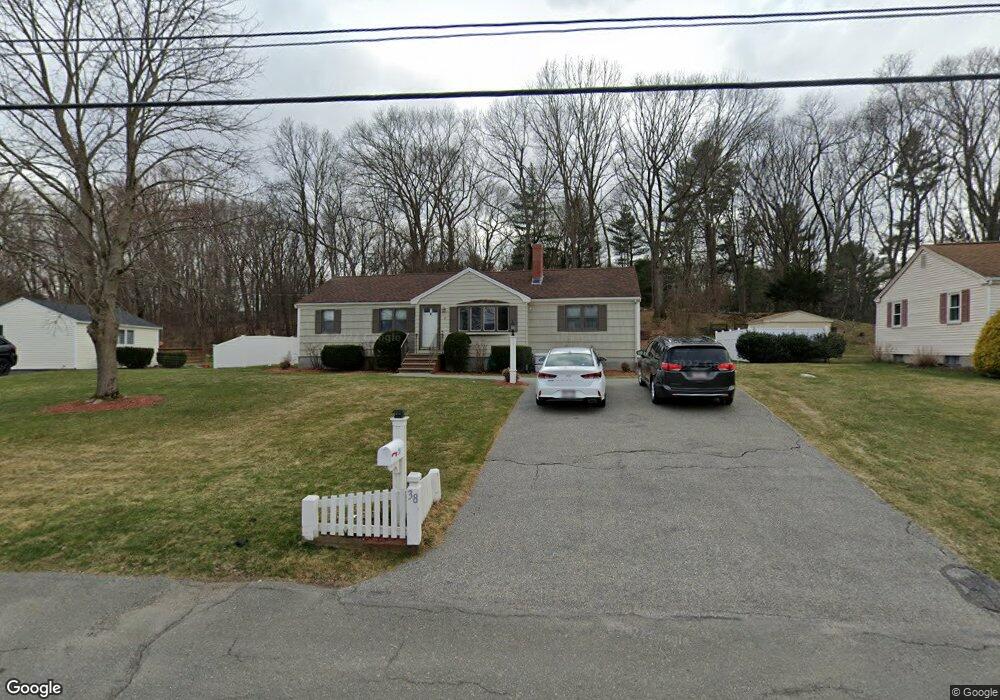
38 Robinson Rd Woburn, MA 01801
Shakerhill NeighborhoodEstimated Value: $766,000 - $905,000
3
Beds
2
Baths
1,654
Sq Ft
$496/Sq Ft
Est. Value
About This Home
This home is located at 38 Robinson Rd, Woburn, MA 01801 and is currently estimated at $819,597, approximately $495 per square foot. 38 Robinson Rd is a home located in Middlesex County with nearby schools including Reeves Elementary School, Daniel L. Joyce Middle School, and Woburn High School.
Ownership History
Date
Name
Owned For
Owner Type
Purchase Details
Closed on
Mar 28, 2024
Sold by
Smith Linda J
Bought by
Linda J Smith Lt and Smith
Current Estimated Value
Create a Home Valuation Report for This Property
The Home Valuation Report is an in-depth analysis detailing your home's value as well as a comparison with similar homes in the area
Home Values in the Area
Average Home Value in this Area
Purchase History
| Date | Buyer | Sale Price | Title Company |
|---|---|---|---|
| Linda J Smith Lt | -- | None Available | |
| Linda J Smith Lt | -- | None Available |
Source: Public Records
Tax History Compared to Growth
Tax History
| Year | Tax Paid | Tax Assessment Tax Assessment Total Assessment is a certain percentage of the fair market value that is determined by local assessors to be the total taxable value of land and additions on the property. | Land | Improvement |
|---|---|---|---|---|
| 2025 | $5,802 | $679,400 | $387,700 | $291,700 |
| 2024 | $5,328 | $661,100 | $369,400 | $291,700 |
| 2023 | $5,372 | $617,500 | $335,900 | $281,600 |
| 2022 | $5,227 | $559,600 | $292,500 | $267,100 |
| 2021 | $13,190 | $528,500 | $278,700 | $249,800 |
| 2020 | $4,643 | $498,200 | $278,700 | $219,500 |
| 2019 | $141 | $470,500 | $265,600 | $204,900 |
| 2018 | $4,298 | $434,600 | $243,900 | $190,700 |
| 2017 | $7,080 | $417,200 | $232,400 | $184,800 |
| 2016 | $3,955 | $393,500 | $217,400 | $176,100 |
| 2015 | $3,798 | $373,500 | $203,300 | $170,200 |
| 2014 | $3,555 | $340,500 | $203,300 | $137,200 |
Source: Public Records
Map
Nearby Homes