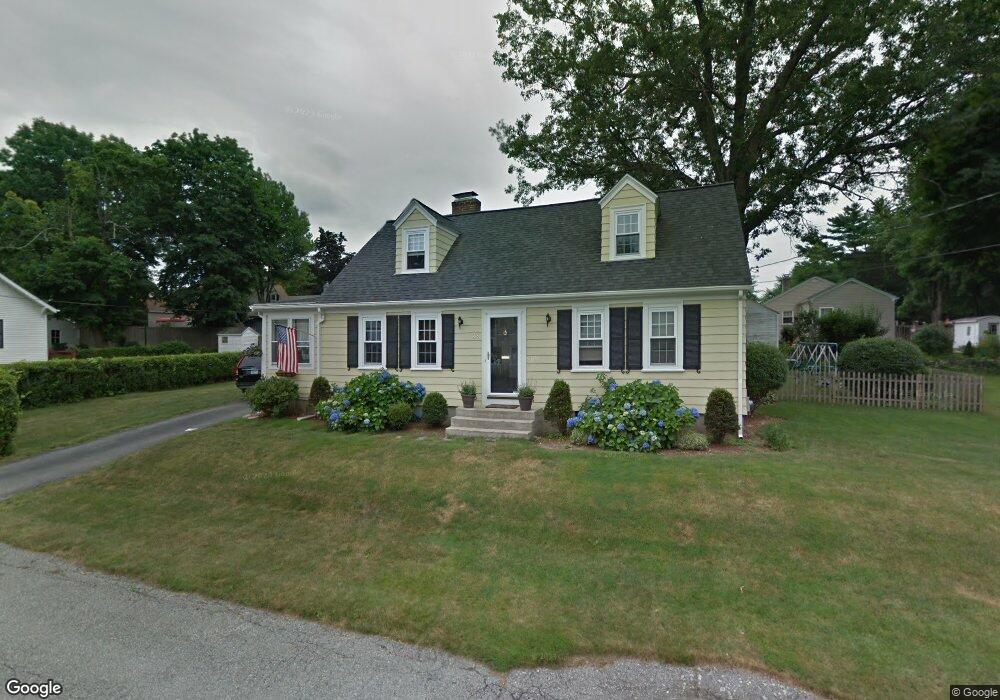
38 Royer St Cranston, RI 02920
Meshanticut NeighborhoodEstimated Value: $444,442 - $510,000
About This Home
This home is located at 38 Royer St, Cranston, RI 02920 and is currently estimated at $486,361, approximately $343 per square foot. 38 Royer St is a home located in Providence County with nearby schools including Glen Hills School, Western Hills Middle School, and Cranston High School West.
Ownership History
We collect this data history from publicly available records. To have your information removed, we recommend requesting removal directly through your county’s website.
Purchase Details
Home Financials for this Owner
Home Financials are based on the most recent Mortgage that was taken out on this home.Purchase Details
Home Values in the Area
Average Home Value in this Area
Purchase History
We collect this data history from publicly available records. To have your information removed, we recommend requesting removal directly through your county’s website.
| Date | Buyer | Sale Price | Title Company |
|---|---|---|---|
| $240,000 | -- | ||
| $125,000 | -- |
Mortgage History
We collect this data history from publicly available records. To have your information removed, we recommend requesting removal directly through your county’s website.
| Date | Status | Borrower | Loan Amount |
|---|---|---|---|
| Open | $224,500 | ||
| Closed | $199,500 | ||
| Closed | $236,900 | ||
| Closed | $242,250 | ||
| Closed | $25,000 |
Tax History
We collect this data history from publicly available records. To have your information removed, we recommend requesting removal directly through your county’s website.
| Year | Tax Paid | Tax Assessment Tax Assessment Total Assessment is a certain percentage of the fair market value that is determined by local assessors to be the total taxable value of land and additions on the property. | Land | Improvement |
|---|---|---|---|---|
| 2025 | $4,908 | $353,600 | $110,000 | $243,600 |
| 2024 | $4,720 | $346,800 | $110,000 | $236,800 |
| 2023 | $4,653 | $246,200 | $72,400 | $173,800 |
| 2022 | $4,557 | $246,200 | $72,400 | $173,800 |
| 2021 | $4,432 | $246,200 | $72,400 | $173,800 |
| 2020 | $4,187 | $201,600 | $69,000 | $132,600 |
| 2019 | $4,187 | $201,600 | $69,000 | $132,600 |
| 2018 | $4,090 | $201,600 | $69,000 | $132,600 |
| 2017 | $3,728 | $162,500 | $62,100 | $100,400 |
| 2016 | $3,648 | $162,500 | $62,100 | $100,400 |
Map
- 7 Oak Tree Ln
- 203 Dean Ridge Ct
- 2249 Cranston St
- 145 E Hill Dr
- 61 Applegate Rd
- 64 White Birch Rd
- 7 White Birch Rd
- 82 Mountain Laurel Dr
- 32 Hoffman Ave
- 94 Greening Ln
- 15 Curtis St Unit 101
- 218 Oaklawn Ave
- 87 Lincoln Park Ave
- 203 Garden Hills Dr
- 61 Metropolitan Ave
- 143 Hoffman Ave Unit 208
- 200 Hoffman Ave Unit 402
- 16 Red Cedar Dr
- 40 Russet Way
- 1100 Phenix Ave
Ask me questions while you tour the home.