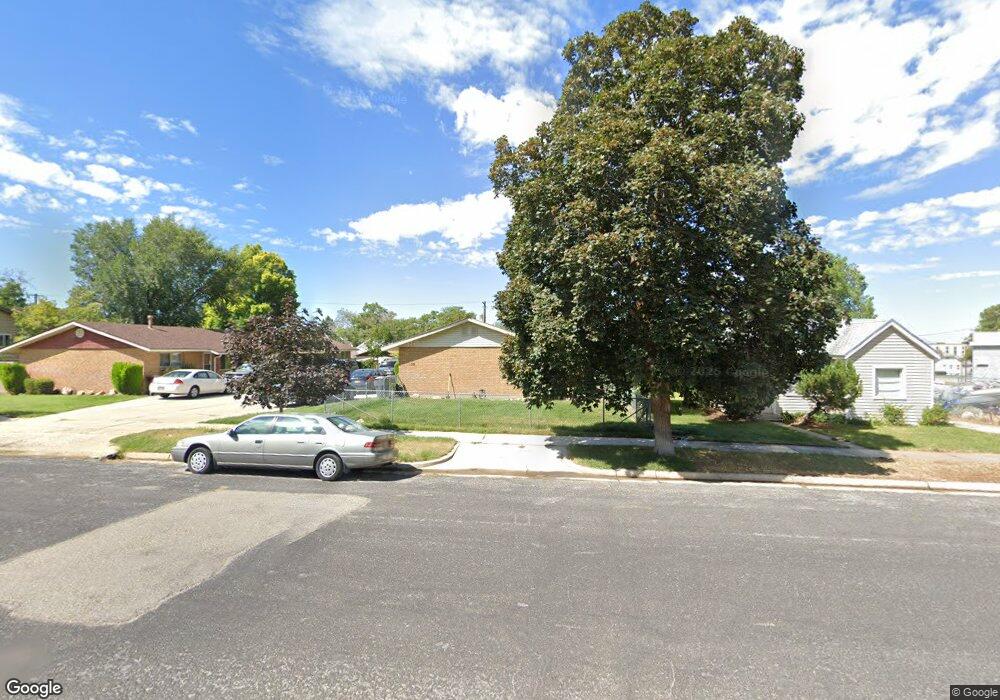
38 S 300 E Brigham City, UT 84302
Estimated Value: $346,600 - $448,000
Studio
--
Bath
1,985
Sq Ft
$198/Sq Ft
Est. Value
About This Home
This home is located at 38 S 300 E, Brigham City, UT 84302 and is currently estimated at $393,650, approximately $198 per square foot. 38 S 300 E is a home with nearby schools including Golden Spike Elementary, Box Elder Middle School, and Adele C. Young Intermediate School.
Ownership History
Date
Name
Owned For
Owner Type
Purchase Details
Closed on
Mar 18, 2021
Sold by
Kitchen Debra Baugh and Baugh Fred B
Bought by
Baugh Investments Llc
Current Estimated Value
Purchase Details
Closed on
Oct 27, 2006
Sold by
Baugh Brothers Investment
Bought by
Bbi Brigham Llc
Purchase Details
Closed on
Aug 4, 2006
Sold by
Baugh Fred
Bought by
Bbi Brigham Llc
Create a Home Valuation Report for This Property
The Home Valuation Report is an in-depth analysis detailing your home's value as well as a comparison with similar homes in the area
Purchase History
| Date | Buyer | Sale Price | Title Company |
|---|---|---|---|
| Baugh Investments Llc | -- | Inwest Title Svcs Inc Logan | |
| Baugh Investments Llc | -- | Inwest Title Svcs Inc Logan | |
| Kitchen Debra Baugh | -- | Inwest Title Svcs Inc Logan | |
| Kitchen Debra Baugh | -- | Inwest Title Svcs Inc Logan | |
| Bbi Brigham Llc | -- | None Available | |
| Bbi Brigham Llc | -- | Cache Title Co |
Source: Public Records
Tax History
| Year | Tax Paid | Tax Assessment Tax Assessment Total Assessment is a certain percentage of the fair market value that is determined by local assessors to be the total taxable value of land and additions on the property. | Land | Improvement |
|---|---|---|---|---|
| 2025 | $1,843 | $316,946 | $105,000 | $211,946 |
| 2024 | $1,455 | $280,036 | $100,000 | $180,036 |
| 2023 | $1,653 | $325,766 | $95,000 | $230,766 |
| 2022 | $1,989 | $364,479 | $40,000 | $324,479 |
| 2021 | $1,597 | $239,017 | $40,000 | $199,017 |
| 2020 | $1,471 | $239,017 | $40,000 | $199,017 |
| 2019 | $1,375 | $118,867 | $22,000 | $96,867 |
| 2018 | $1,236 | $106,232 | $22,000 | $84,232 |
| 2017 | $1,067 | $158,737 | $16,500 | $128,737 |
| 2016 | $1,115 | $83,934 | $16,500 | $67,434 |
| 2015 | $1,033 | $77,804 | $16,500 | $61,304 |
| 2014 | $1,033 | $74,884 | $16,500 | $58,384 |
| 2013 | -- | $74,884 | $16,500 | $58,384 |
Source: Public Records
Map
Nearby Homes
Your Personal Tour Guide
Ask me questions while you tour the home.