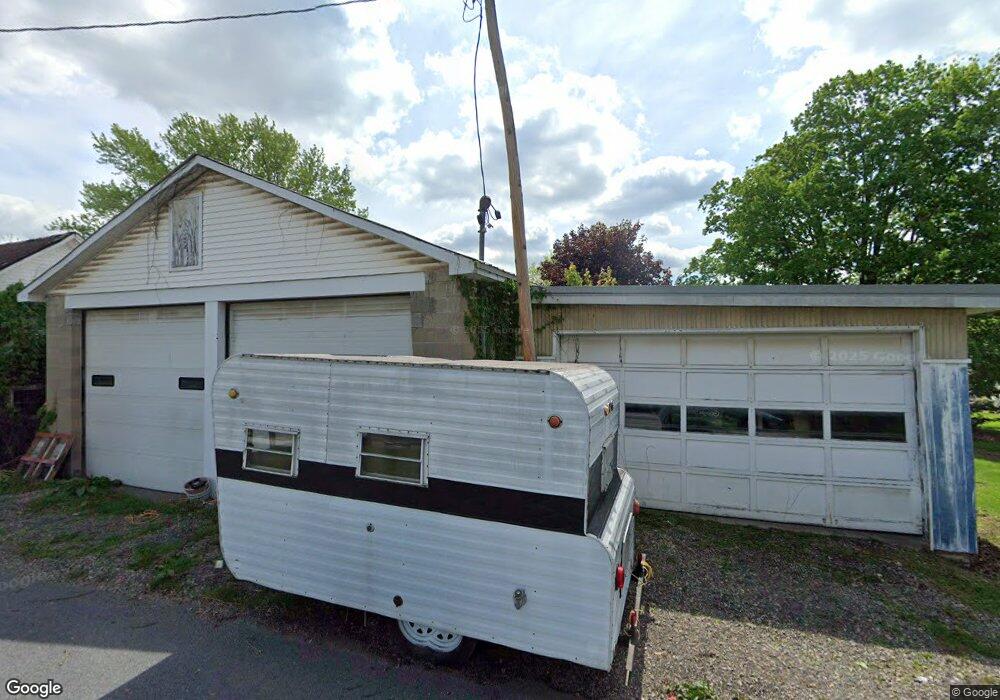
38 S Grant St Homer City, PA 15748
Estimated Value: $140,000 - $198,000
3
Beds
1
Bath
2,602
Sq Ft
$68/Sq Ft
Est. Value
About This Home
This home is located at 38 S Grant St, Homer City, PA 15748 and is currently estimated at $175,726, approximately $67 per square foot. 38 S Grant St is a home located in Indiana County with nearby schools including Homer-Center Elementary School and Homer-Center Junior/Senior High School.
Ownership History
Date
Name
Owned For
Owner Type
Purchase Details
Closed on
Oct 10, 2006
Sold by
Coleman Gregory B and Coleman Kimberly C
Bought by
Szenyo Jeffrey A
Current Estimated Value
Home Financials for this Owner
Home Financials are based on the most recent Mortgage that was taken out on this home.
Original Mortgage
$104,000
Outstanding Balance
$9,694
Interest Rate
6.48%
Mortgage Type
New Conventional
Estimated Equity
$166,032
Create a Home Valuation Report for This Property
The Home Valuation Report is an in-depth analysis detailing your home's value as well as a comparison with similar homes in the area
Home Values in the Area
Average Home Value in this Area
Purchase History
| Date | Buyer | Sale Price | Title Company |
|---|---|---|---|
| Szenyo Jeffrey A | $130,000 | None Available |
Source: Public Records
Mortgage History
| Date | Status | Borrower | Loan Amount |
|---|---|---|---|
| Open | Szenyo Jeffrey A | $104,000 |
Source: Public Records
Tax History Compared to Growth
Tax History
| Year | Tax Paid | Tax Assessment Tax Assessment Total Assessment is a certain percentage of the fair market value that is determined by local assessors to be the total taxable value of land and additions on the property. | Land | Improvement |
|---|---|---|---|---|
| 2025 | $3,417 | $121,500 | $20,000 | $101,500 |
| 2024 | $3,369 | $121,500 | $20,000 | $101,500 |
| 2023 | $3,190 | $121,500 | $20,000 | $101,500 |
| 2022 | $3,048 | $121,500 | $20,000 | $101,500 |
| 2021 | $3,048 | $121,500 | $20,000 | $101,500 |
| 2020 | $2,992 | $121,500 | $20,000 | $101,500 |
| 2018 | $2,976 | $121,500 | $20,000 | $101,500 |
| 2017 | $2,989 | $121,500 | $20,000 | $101,500 |
| 2016 | -- | $121,500 | $20,000 | $101,500 |
| 2015 | -- | $19,310 | $2,160 | $17,150 |
| 2014 | -- | $19,310 | $2,160 | $17,150 |
Source: Public Records
Map
Nearby Homes