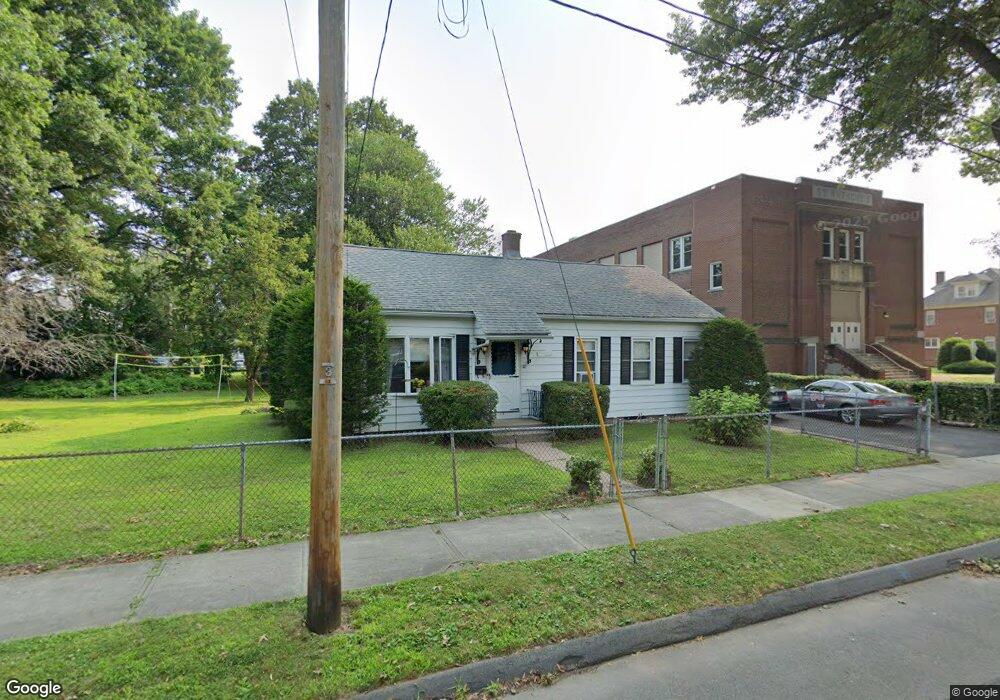
38 Saint Anthony St Chicopee, MA 01013
Willimansett NeighborhoodEstimated Value: $236,000 - $283,697
2
Beds
1
Bath
950
Sq Ft
$268/Sq Ft
Est. Value
About This Home
This home is located at 38 Saint Anthony St, Chicopee, MA 01013 and is currently estimated at $254,174, approximately $267 per square foot. 38 Saint Anthony St is a home located in Hampden County with nearby schools including Fairview Elementary School, Bellamy Middle School, and Chicopee High School.
Ownership History
Date
Name
Owned For
Owner Type
Purchase Details
Closed on
Oct 31, 2022
Sold by
Dyka Carl T
Bought by
Castillo Jose
Current Estimated Value
Home Financials for this Owner
Home Financials are based on the most recent Mortgage that was taken out on this home.
Original Mortgage
$148,000
Outstanding Balance
$142,225
Interest Rate
6.02%
Mortgage Type
Purchase Money Mortgage
Estimated Equity
$111,949
Create a Home Valuation Report for This Property
The Home Valuation Report is an in-depth analysis detailing your home's value as well as a comparison with similar homes in the area
Home Values in the Area
Average Home Value in this Area
Purchase History
| Date | Buyer | Sale Price | Title Company |
|---|---|---|---|
| Castillo Jose | $185,000 | None Available | |
| Castillo Jose | $185,000 | None Available |
Source: Public Records
Mortgage History
| Date | Status | Borrower | Loan Amount |
|---|---|---|---|
| Open | Castillo Jose | $148,000 | |
| Closed | Castillo Jose | $148,000 |
Source: Public Records
Tax History
| Year | Tax Paid | Tax Assessment Tax Assessment Total Assessment is a certain percentage of the fair market value that is determined by local assessors to be the total taxable value of land and additions on the property. | Land | Improvement |
|---|---|---|---|---|
| 2025 | $2,815 | $185,700 | $102,600 | $83,100 |
| 2024 | $2,677 | $181,400 | $100,600 | $80,800 |
| 2023 | $3,235 | $213,500 | $91,500 | $122,000 |
| 2022 | $3,106 | $182,800 | $79,500 | $103,300 |
| 2021 | $2,937 | $166,800 | $72,300 | $94,500 |
| 2020 | $2,809 | $160,900 | $72,300 | $88,600 |
| 2019 | $2,778 | $154,700 | $72,300 | $82,400 |
| 2018 | $2,699 | $147,400 | $68,900 | $78,500 |
| 2017 | $2,482 | $143,400 | $68,800 | $74,600 |
| 2016 | $2,337 | $138,200 | $68,800 | $69,400 |
| 2015 | $2,287 | $130,400 | $68,800 | $61,600 |
| 2014 | $894 | $130,400 | $68,800 | $61,600 |
Source: Public Records
Map
Nearby Homes
- 38 St Anthony St
- 24 Saint Anthony St
- 24 Saint Anthony St Unit 1
- 24 Saint Anthony St
- 35 Saint Anthony St
- 18 St Anthony St
- 18 St Anthony St Unit 3
- 18 St Anthony St Unit 2
- 18 St Anthony St Unit 1
- 25 Saint Anthony St
- 23 Celestine St
- 53 Saint Anthony St
- 18 Saint Anthony St
- 18 Saint Anthony St Unit 1
- 15 Celestine St
- 43 Saint Anthony St
- 53 St Anthony St
- 561 Chicopee St
- 38 Charpentier Blvd
- 48 Charpentier Blvd
Your Personal Tour Guide
Ask me questions while you tour the home.