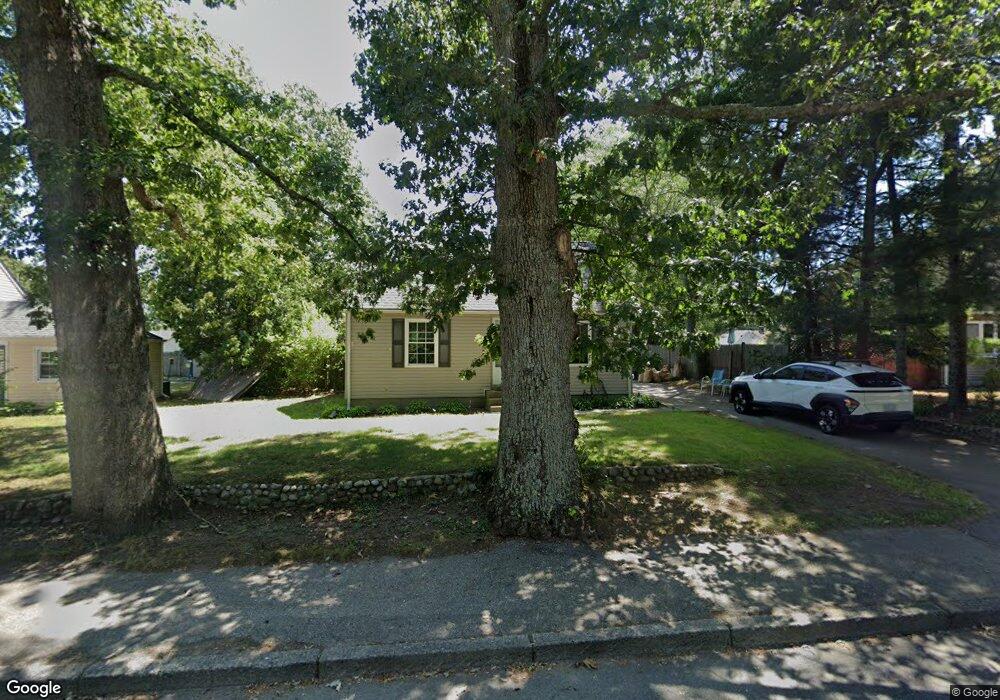
38 School St North Kingstown, RI 02852
Davisville NeighborhoodEstimated Value: $368,000 - $481,000
3
Beds
1
Bath
1,517
Sq Ft
$288/Sq Ft
Est. Value
About This Home
This home is located at 38 School St, North Kingstown, RI 02852 and is currently estimated at $436,194, approximately $287 per square foot. 38 School St is a home located in Washington County with nearby schools including Forest Park Elementary School, Davisville Middle School, and North Kingstown Sr. High School.
Ownership History
Date
Name
Owned For
Owner Type
Purchase Details
Closed on
Sep 30, 2008
Sold by
Hsbc Bank Usa
Bought by
Ginis Isaac
Current Estimated Value
Purchase Details
Closed on
Jun 12, 2008
Sold by
Ashley Christopher and Ashley Cynthia
Bought by
Hsbc Bank Usa
Purchase Details
Closed on
May 9, 2000
Sold by
G-Darbrosca Karen and Darbrosca Vincent
Bought by
Ashley Christopher and Ashley Cynthia
Create a Home Valuation Report for This Property
The Home Valuation Report is an in-depth analysis detailing your home's value as well as a comparison with similar homes in the area
Home Values in the Area
Average Home Value in this Area
Purchase History
| Date | Buyer | Sale Price | Title Company |
|---|---|---|---|
| Ginis Isaac | $143,000 | -- | |
| Hsbc Bank Usa | $203,500 | -- | |
| Ashley Christopher | $102,500 | -- |
Source: Public Records
Mortgage History
| Date | Status | Borrower | Loan Amount |
|---|---|---|---|
| Previous Owner | Ashley Christopher | $178,500 | |
| Previous Owner | Ashley Christopher | $138,500 | |
| Previous Owner | Ashley Christopher | $109,975 |
Source: Public Records
Tax History Compared to Growth
Tax History
| Year | Tax Paid | Tax Assessment Tax Assessment Total Assessment is a certain percentage of the fair market value that is determined by local assessors to be the total taxable value of land and additions on the property. | Land | Improvement |
|---|---|---|---|---|
| 2025 | $3,834 | $347,300 | $145,500 | $201,800 |
| 2024 | $3,968 | $276,700 | $108,700 | $168,000 |
| 2023 | $3,968 | $276,700 | $108,700 | $168,000 |
| 2022 | $3,890 | $276,700 | $108,700 | $168,000 |
| 2021 | $3,747 | $214,100 | $74,900 | $139,200 |
| 2020 | $3,659 | $214,100 | $74,900 | $139,200 |
| 2019 | $3,659 | $214,100 | $74,900 | $139,200 |
| 2018 | $3,282 | $173,000 | $65,100 | $107,900 |
| 2017 | $3,216 | $173,000 | $65,100 | $107,900 |
| 2016 | $3,124 | $173,000 | $65,100 | $107,900 |
| 2015 | $3,125 | $161,900 | $71,600 | $90,300 |
| 2014 | $3,062 | $161,900 | $71,600 | $90,300 |
Source: Public Records
Map
Nearby Homes