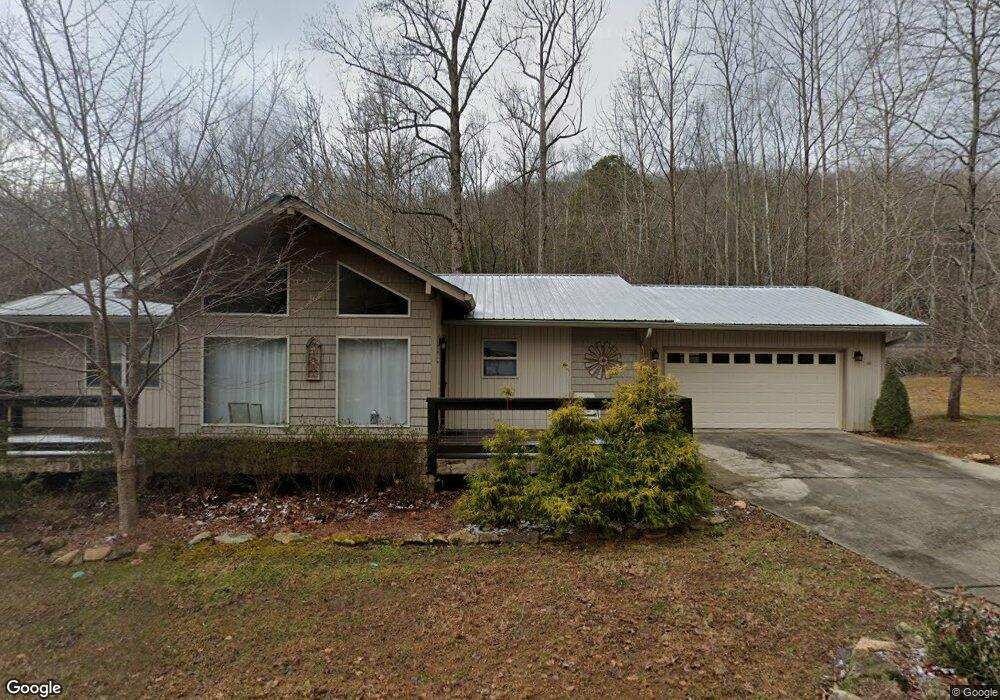
38 Seabrook Ln Clayton, GA 30525
Estimated Value: $556,189 - $644,000
3
Beds
2
Baths
1,434
Sq Ft
$409/Sq Ft
Est. Value
About This Home
This home is located at 38 Seabrook Ln, Clayton, GA 30525 and is currently estimated at $587,047, approximately $409 per square foot. 38 Seabrook Ln is a home located in Rabun County with nearby schools including Rabun County Primary School and Rabun County High School.
Ownership History
Date
Name
Owned For
Owner Type
Purchase Details
Closed on
Aug 6, 2020
Sold by
Christy Devin Clay
Bought by
Mckinnon Melinda V and Mckinnon Robert A
Current Estimated Value
Home Financials for this Owner
Home Financials are based on the most recent Mortgage that was taken out on this home.
Original Mortgage
$229,360
Outstanding Balance
$202,080
Interest Rate
3%
Mortgage Type
New Conventional
Estimated Equity
$384,967
Purchase Details
Closed on
Jun 29, 2017
Sold by
Primeau Dennis M
Bought by
Christy Devin Clay and Christy Minda D
Home Financials for this Owner
Home Financials are based on the most recent Mortgage that was taken out on this home.
Original Mortgage
$243,000
Interest Rate
3.94%
Mortgage Type
New Conventional
Purchase Details
Closed on
Feb 2, 2016
Sold by
Regions Bank
Bought by
Primeau Dennis M and Primeau Glenda T
Home Financials for this Owner
Home Financials are based on the most recent Mortgage that was taken out on this home.
Original Mortgage
$120,000
Interest Rate
3.97%
Mortgage Type
Commercial
Create a Home Valuation Report for This Property
The Home Valuation Report is an in-depth analysis detailing your home's value as well as a comparison with similar homes in the area
Home Values in the Area
Average Home Value in this Area
Purchase History
| Date | Buyer | Sale Price | Title Company |
|---|---|---|---|
| Mckinnon Melinda V | $286,700 | -- | |
| Mckinnon Melinda V | $286,700 | -- | |
| Christy Devin Clay | $270,000 | -- | |
| Christy Devin Clay | $270,000 | -- | |
| Primeau Dennis M | $150,000 | -- | |
| Primeau Dennis M | $150,000 | -- |
Source: Public Records
Mortgage History
| Date | Status | Borrower | Loan Amount |
|---|---|---|---|
| Open | Mckinnon Melinda V | $229,360 | |
| Closed | Mckinnon Melinda V | $229,360 | |
| Previous Owner | Christy Devin Clay | $243,000 | |
| Previous Owner | Primeau Dennis M | $120,000 |
Source: Public Records
Tax History Compared to Growth
Tax History
| Year | Tax Paid | Tax Assessment Tax Assessment Total Assessment is a certain percentage of the fair market value that is determined by local assessors to be the total taxable value of land and additions on the property. | Land | Improvement |
|---|---|---|---|---|
| 2025 | $1,312 | $86,456 | $0 | $86,456 |
| 2024 | $1,287 | $80,186 | $0 | $80,186 |
| 2023 | $1,369 | $74,794 | $0 | $74,794 |
| 2022 | $1,323 | $72,284 | $0 | $72,284 |
| 2021 | $1,220 | $65,057 | $0 | $65,057 |
| 2020 | $1,246 | $64,245 | $0 | $64,245 |
| 2019 | $1,245 | $63,748 | $0 | $63,748 |
| 2018 | $1,250 | $63,748 | $0 | $63,748 |
| 2017 | $1,198 | $63,748 | $0 | $63,748 |
| 2016 | $1,202 | $63,748 | $0 | $63,748 |
| 2015 | $1,223 | $63,512 | $0 | $63,512 |
| 2014 | $1,230 | $63,512 | $0 | $63,512 |
Source: Public Records
Map
Nearby Homes
- 263 Seabrook Ln
- 207 Raindance Ln
- 234 Raindance Ln
- 0 Hwy 197 Unit 10608906
- 132 Summit Ridge Dr
- 0 Ivy Ridge Unit 10528111
- 117 Ivy Ridge Way
- 0 Crows Nest Dr
- 1242 Moccasin Creek Rd Unit L
- 1349 Dicks Creek Rd
- 605 Wildcat Rd
- 90 Cove View Ln
- 130 Cove View Ln
- 876 Whitetail Trail
- 171 High Pointe Dr
- 177 Whitetail Trail
- 123 Village Club Trail
- L-3 High Pointe Dr Unit L-3
- A19 Winterberry Dr
- 655 Bent Grass Way
- 38 Seabrook Ln Unit 2224
- 2181 Highway 197
- 39 Seabrook Ln
- 39 Seabrook Ln Unit 2222
- 81 Seabrook Ln
- 2059 Highway 197 Unit 17
- 72 Seabrook Ln
- 115 Seabrook Ln
- 2057 Hwy 197
- 2265 Highway 197
- 135 Seabrook Ln Unit 11
- 135 Seabrook Ln
- 0 Seabrook Ln Unit 8824920
- 118 Seabrook Ln
- 14 Landing Ln
- 24 Seabrook Ln
- 157 Seabrook Ln
- 132 Seabrook Ln
- 2303 Georgia 197
- 150 Seabrook Ln