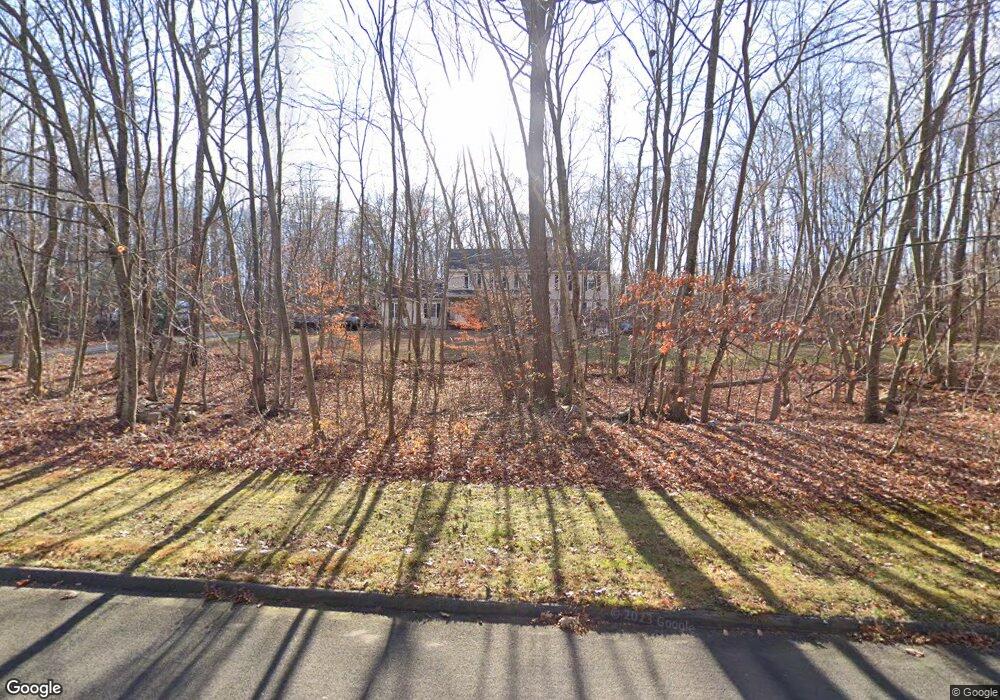
38 Sean Cir Coventry, CT 06238
Estimated Value: $517,000 - $558,950
About This Home
This home is located at 38 Sean Cir, Coventry, CT 06238 and is currently estimated at $537,488, approximately $218 per square foot. 38 Sean Cir is a home located in Tolland County with nearby schools including George Hersey Robertson School, Coventry Grammar School, and Capt. Nathan Hale School.
Ownership History
We collect this data history from publicly available records. To have your information removed, we recommend requesting removal directly through your county’s website.
Purchase Details
Home Financials for this Owner
Home Financials are based on the most recent Mortgage that was taken out on this home.Home Values in the Area
Average Home Value in this Area
Purchase History
We collect this data history from publicly available records. To have your information removed, we recommend requesting removal directly through your county’s website.
| Date | Buyer | Sale Price | Title Company |
|---|---|---|---|
| $180,000 | -- | ||
| $180,000 | -- |
Mortgage History
We collect this data history from publicly available records. To have your information removed, we recommend requesting removal directly through your county’s website.
| Date | Status | Borrower | Loan Amount |
|---|---|---|---|
| Closed | $41,000 | ||
| Closed | $46,000 | ||
| Closed | $159,795 | ||
| Closed | $162,000 |
Tax History
We collect this data history from publicly available records. To have your information removed, we recommend requesting removal directly through your county’s website.
| Year | Tax Paid | Tax Assessment Tax Assessment Total Assessment is a certain percentage of the fair market value that is determined by local assessors to be the total taxable value of land and additions on the property. | Land | Improvement |
|---|---|---|---|---|
| 2025 | $7,598 | $319,800 | $68,300 | $251,500 |
| 2024 | $7,292 | $218,900 | $56,600 | $162,300 |
| 2023 | $6,948 | $218,900 | $56,600 | $162,300 |
| 2022 | $6,819 | $218,900 | $56,600 | $162,300 |
| 2021 | $6,819 | $218,900 | $56,600 | $162,300 |
| 2020 | $6,823 | $218,900 | $56,600 | $162,300 |
| 2019 | $7,052 | $219,000 | $56,600 | $162,400 |
| 2018 | $6,527 | $202,700 | $56,600 | $146,100 |
| 2017 | $6,486 | $202,700 | $56,600 | $146,100 |
| 2016 | $6,324 | $202,700 | $56,600 | $146,100 |
| 2015 | $5,098 | $163,400 | $56,600 | $106,800 |
| 2014 | $4,996 | $175,500 | $68,500 | $107,000 |
Map
- 94 Stonehouse Rd Unit 14
- 1079 Main St
- 0 Woodland Rd
- 398 Ripley Hill Rd
- 28 Armstrong Rd Unit C20
- 28 Armstrong Rd Unit C28
- 220 Springdale Ave
- 285 Woodland Rd
- 829 Stafford Rd
- 828 Stafford Rd
- 312 Shore Dr
- 1169 Flanders Rd
- 152 Cheney Ln
- 34 Avery Shores
- 111 Depot Rd
- 5 Avery Shores
- 174 Ravine Ln
- 91 Washburn Ave
- 467 S Street Extension
- 31 Wyllys Farm Rd
Ask me questions while you tour the home.