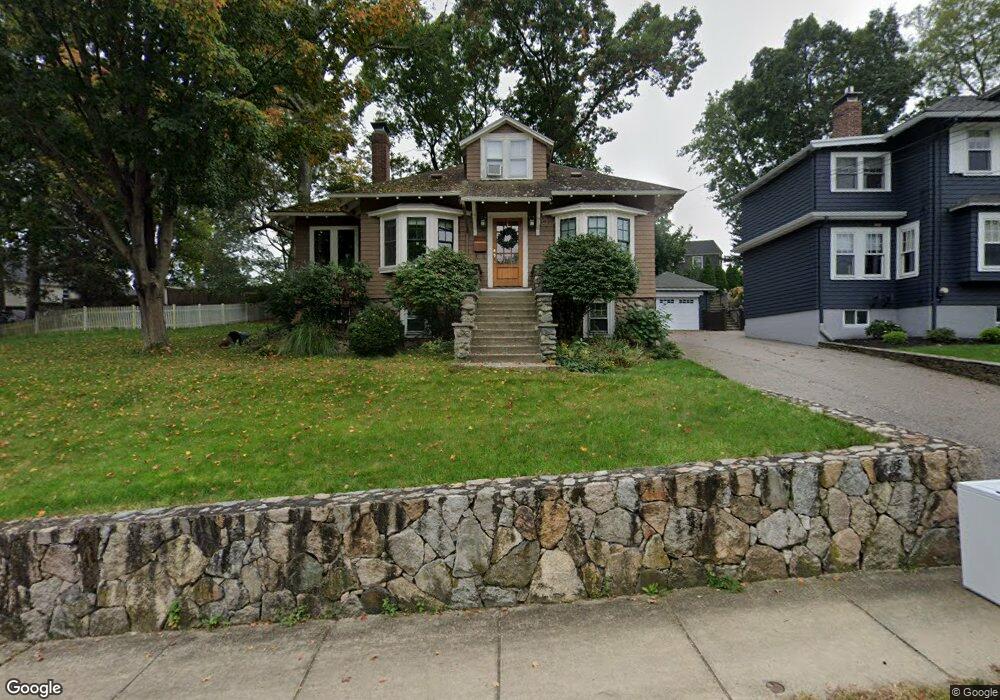
38 Shirley Rd Waltham, MA 02452
North Waltham NeighborhoodEstimated Value: $818,000 - $910,000
3
Beds
1
Bath
1,427
Sq Ft
$604/Sq Ft
Est. Value
About This Home
This home is located at 38 Shirley Rd, Waltham, MA 02452 and is currently estimated at $861,491, approximately $603 per square foot. 38 Shirley Rd is a home located in Middlesex County with nearby schools including Northeast Elementary School, John F Kennedy Middle School, and Waltham Sr High School.
Ownership History
Date
Name
Owned For
Owner Type
Purchase Details
Closed on
Jul 10, 2000
Sold by
Shea Kevin
Bought by
Graham Gregory E
Current Estimated Value
Home Financials for this Owner
Home Financials are based on the most recent Mortgage that was taken out on this home.
Original Mortgage
$260,000
Outstanding Balance
$95,144
Interest Rate
8.55%
Mortgage Type
Purchase Money Mortgage
Estimated Equity
$766,347
Purchase Details
Closed on
Feb 16, 1995
Sold by
Bliven Peter D and Bliven Marie A
Bought by
Shea Kevin
Create a Home Valuation Report for This Property
The Home Valuation Report is an in-depth analysis detailing your home's value as well as a comparison with similar homes in the area
Home Values in the Area
Average Home Value in this Area
Purchase History
| Date | Buyer | Sale Price | Title Company |
|---|---|---|---|
| Graham Gregory E | $325,000 | -- | |
| Shea Kevin | $151,000 | -- |
Source: Public Records
Mortgage History
| Date | Status | Borrower | Loan Amount |
|---|---|---|---|
| Open | Shea Kevin | $260,000 | |
| Previous Owner | Shea Kevin | $20,000 | |
| Previous Owner | Shea Kevin | $204,000 |
Source: Public Records
Tax History Compared to Growth
Tax History
| Year | Tax Paid | Tax Assessment Tax Assessment Total Assessment is a certain percentage of the fair market value that is determined by local assessors to be the total taxable value of land and additions on the property. | Land | Improvement |
|---|---|---|---|---|
| 2025 | $6,759 | $688,300 | $444,200 | $244,100 |
| 2024 | $6,414 | $665,400 | $423,400 | $242,000 |
| 2023 | $6,358 | $616,100 | $384,900 | $231,200 |
| 2022 | $6,674 | $599,100 | $377,200 | $221,900 |
| 2021 | $6,490 | $573,300 | $361,800 | $211,500 |
| 2020 | $5,322 | $533,200 | $338,700 | $194,500 |
| 2019 | $6,230 | $492,100 | $324,300 | $167,800 |
| 2018 | $4,823 | $441,400 | $300,200 | $141,200 |
| 2017 | $5,206 | $414,500 | $273,300 | $141,200 |
| 2016 | $4,933 | $403,000 | $261,800 | $141,200 |
| 2015 | $4,957 | $377,500 | $234,800 | $142,700 |
Source: Public Records
Map
Nearby Homes
- 26 Brookfield Rd
- 100 Shirley Rd
- 51 S Cottage Rd Unit 112
- 50 Moraine St
- 45 Chase Rd
- 38 Van Vechten St
- 51 Harrington St Unit 51
- 51 Harrington St Unit 53
- 236 Sycamore St
- 253 Sycamore St Unit 253
- 36 Hollace St
- 1 Bridgham Ave
- 9 Stanley Rd
- 57 Pierce Rd Unit 57
- 55-57 Hawthorne St
- 160 Waverley St
- 28 Whitney St
- 88 Bartlett Ave
- 72-74 Flett Rd
- 266 Linden St