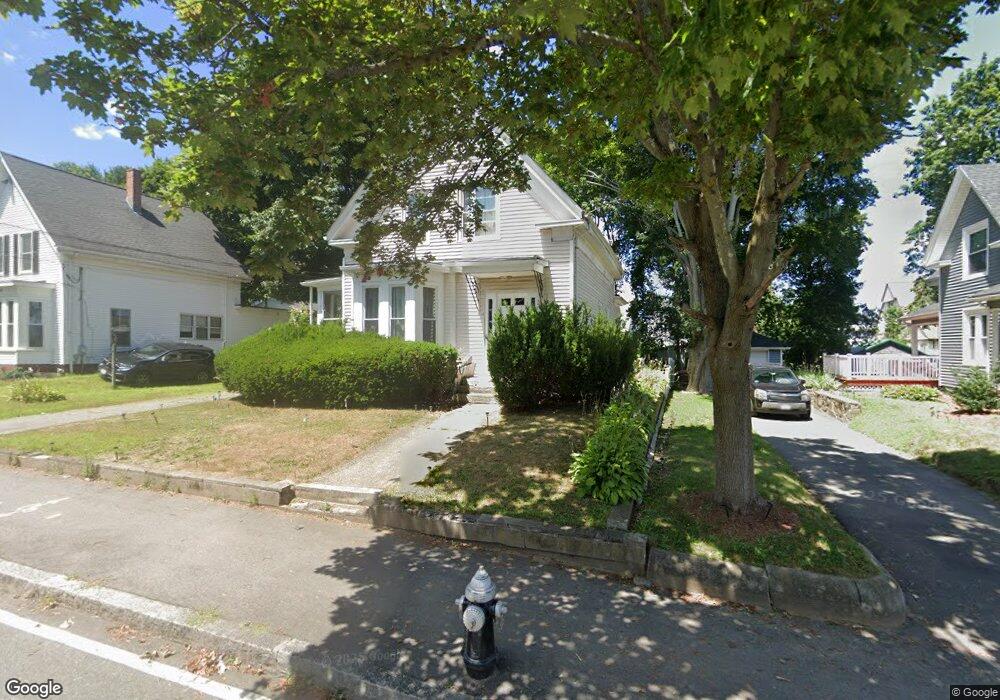
38 Snell St Brockton, MA 02301
Montello NeighborhoodEstimated Value: $468,647 - $591,000
3
Beds
1
Bath
1,497
Sq Ft
$341/Sq Ft
Est. Value
About This Home
This home is located at 38 Snell St, Brockton, MA 02301 and is currently estimated at $510,662, approximately $341 per square foot. 38 Snell St is a home located in Plymouth County with nearby schools including Raymond K-8 Elementary School, Louis F Angelo Elementary School, and Manthala George Jr. School.
Ownership History
Date
Name
Owned For
Owner Type
Purchase Details
Closed on
Dec 11, 2025
Sold by
Nelson Chantale A
Bought by
Chante A Nelson Lt and Nelson
Current Estimated Value
Purchase Details
Closed on
Aug 13, 2001
Sold by
Camilien Laurie and Montinard Marie G
Bought by
Nelson Chantel
Home Financials for this Owner
Home Financials are based on the most recent Mortgage that was taken out on this home.
Original Mortgage
$172,900
Interest Rate
7.1%
Mortgage Type
Purchase Money Mortgage
Create a Home Valuation Report for This Property
The Home Valuation Report is an in-depth analysis detailing your home's value as well as a comparison with similar homes in the area
Home Values in the Area
Average Home Value in this Area
Purchase History
| Date | Buyer | Sale Price | Title Company |
|---|---|---|---|
| Chante A Nelson Lt | -- | -- | |
| Nelson Chantel | $182,000 | -- |
Source: Public Records
Mortgage History
| Date | Status | Borrower | Loan Amount |
|---|---|---|---|
| Previous Owner | Nelson Chantel | $227,000 | |
| Previous Owner | Nelson Chantel | $216,750 | |
| Previous Owner | Nelson Chantel | $183,000 | |
| Previous Owner | Nelson Chantel | $172,900 |
Source: Public Records
Tax History
| Year | Tax Paid | Tax Assessment Tax Assessment Total Assessment is a certain percentage of the fair market value that is determined by local assessors to be the total taxable value of land and additions on the property. | Land | Improvement |
|---|---|---|---|---|
| 2025 | $5,078 | $419,300 | $140,400 | $278,900 |
| 2024 | $4,759 | $395,900 | $140,400 | $255,500 |
| 2023 | $4,481 | $345,200 | $105,800 | $239,400 |
| 2022 | $4,609 | $329,900 | $96,200 | $233,700 |
| 2021 | $4,112 | $283,600 | $80,200 | $203,400 |
| 2020 | $3,995 | $263,700 | $74,800 | $188,900 |
| 2019 | $4,082 | $262,700 | $72,900 | $189,800 |
| 2018 | $3,512 | $218,700 | $72,900 | $145,800 |
| 2017 | $3,259 | $202,400 | $72,900 | $129,500 |
| 2016 | $3,191 | $183,800 | $70,700 | $113,100 |
| 2015 | $2,764 | $152,300 | $70,700 | $81,600 |
| 2014 | $2,814 | $155,200 | $70,700 | $84,500 |
Source: Public Records
Map
Nearby Homes
Your Personal Tour Guide
Ask me questions while you tour the home.