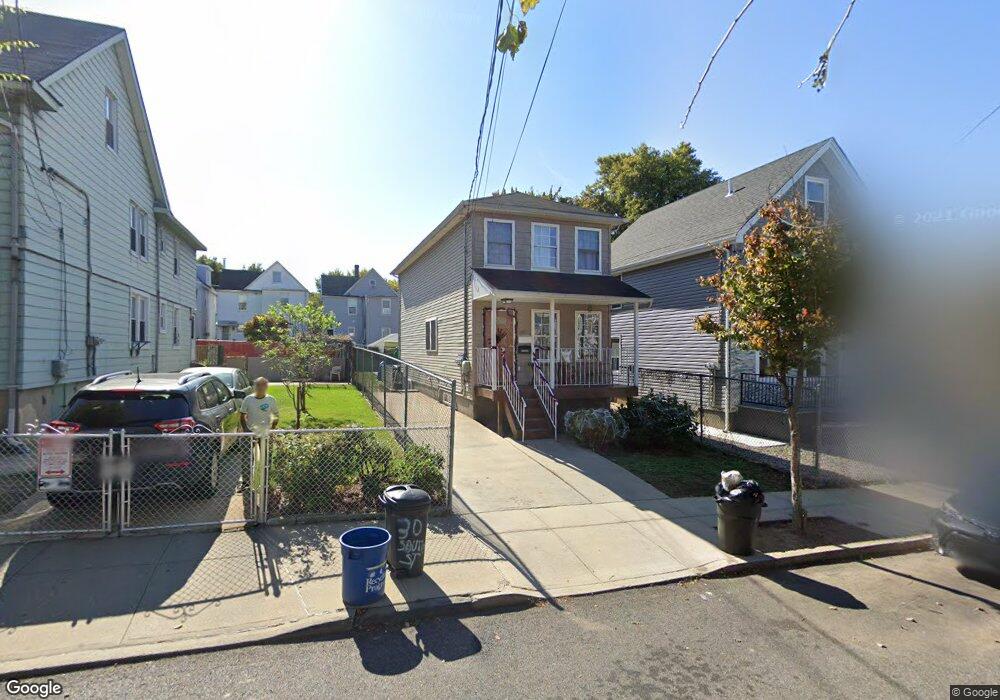
38 South St Staten Island, NY 10310
West Brighton NeighborhoodEstimated Value: $554,000 - $785,000
3
Beds
3
Baths
1,832
Sq Ft
$357/Sq Ft
Est. Value
About This Home
This home is located at 38 South St, Staten Island, NY 10310 and is currently estimated at $654,910, approximately $357 per square foot. 38 South St is a home located in Richmond County with nearby schools including P.S. 45 John Tyler, Intermediate School 27, and Susan E Wagner High School.
Ownership History
Date
Name
Owned For
Owner Type
Purchase Details
Closed on
Oct 19, 2015
Sold by
Farinacci Philip
Bought by
Over Development Ltd
Current Estimated Value
Purchase Details
Closed on
Oct 16, 2007
Sold by
Over Development Ltd
Bought by
Farinacci Philip
Home Financials for this Owner
Home Financials are based on the most recent Mortgage that was taken out on this home.
Original Mortgage
$224,000
Interest Rate
8%
Mortgage Type
Purchase Money Mortgage
Create a Home Valuation Report for This Property
The Home Valuation Report is an in-depth analysis detailing your home's value as well as a comparison with similar homes in the area
Home Values in the Area
Average Home Value in this Area
Purchase History
| Date | Buyer | Sale Price | Title Company |
|---|---|---|---|
| Over Development Ltd | -- | None Available | |
| Farinacci Philip | -- | Fidelity Natl Title Ins Co |
Source: Public Records
Mortgage History
| Date | Status | Borrower | Loan Amount |
|---|---|---|---|
| Previous Owner | Farinacci Philip | $224,000 |
Source: Public Records
Tax History Compared to Growth
Tax History
| Year | Tax Paid | Tax Assessment Tax Assessment Total Assessment is a certain percentage of the fair market value that is determined by local assessors to be the total taxable value of land and additions on the property. | Land | Improvement |
|---|---|---|---|---|
| 2025 | $5,273 | $32,280 | $10,501 | $21,779 |
| 2024 | $5,273 | $34,440 | $9,285 | $25,155 |
| 2023 | $5,030 | $24,768 | $7,416 | $17,352 |
| 2022 | $4,944 | $33,840 | $12,180 | $21,660 |
| 2021 | $5,173 | $31,320 | $12,180 | $19,140 |
| 2020 | $8,396 | $30,960 | $12,180 | $18,780 |
| 2019 | $13,556 | $28,020 | $12,180 | $15,840 |
| 2018 | $4,207 | $20,640 | $12,180 | $8,460 |
| 2017 | $4,661 | $22,867 | $11,782 | $11,085 |
| 2016 | $4,313 | $21,573 | $11,998 | $9,575 |
| 2015 | $3,685 | $20,352 | $12,398 | $7,954 |
| 2014 | $3,685 | $19,200 | $13,560 | $5,640 |
Source: Public Records
Map
Nearby Homes
- 56 South St
- 361 Broadway
- 305 Broadway
- 386 N Burgher Ave
- 1001 Castleton Ave
- 1064 Castleton Ave
- 943 Castleton Ave
- 555 Delafield Ave
- 46 Winegar Ln
- 207 N Burgher Ave
- 335 Oakland Ave
- 331 Oakland Ave
- 698 Henderson Ave
- 718 Henderson Ave
- 46 Elizabeth St
- 432 Pelton Ave
- 699 Henderson Ave
- 582 Cary Ave
- 123 Roe St
- 657 Delafield Ave