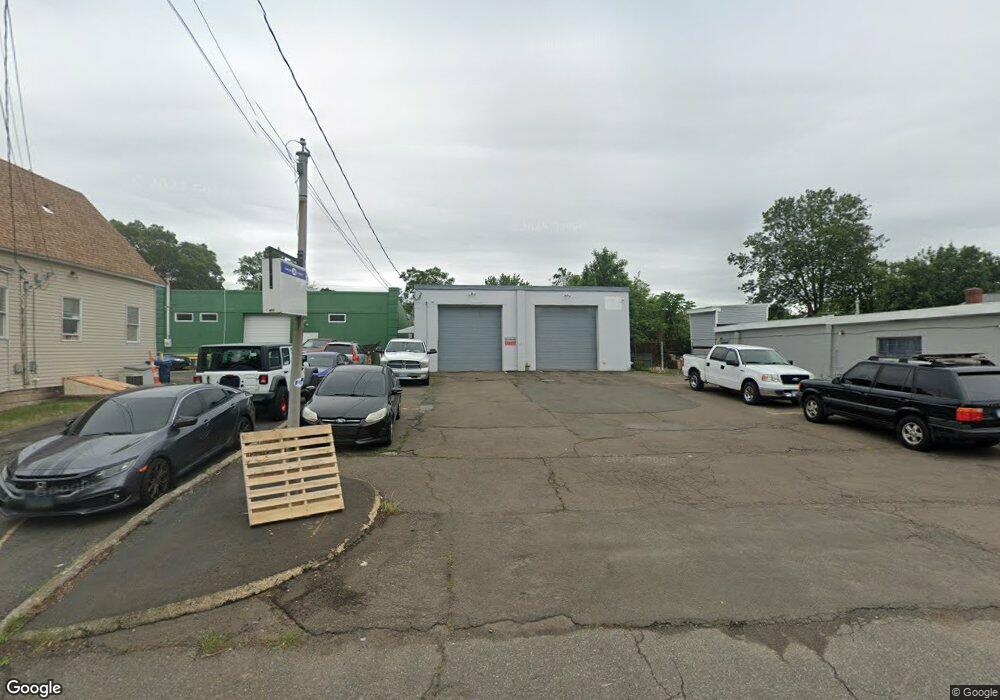
38 Spring St West Haven, CT 06516
Allingtown NeighborhoodEstimated Value: $557,005
--
Bed
--
Bath
2,190
Sq Ft
$254/Sq Ft
Est. Value
About This Home
This home is located at 38 Spring St, West Haven, CT 06516 and is currently estimated at $557,005, approximately $254 per square foot. 38 Spring St is a home located in New Haven County with nearby schools including Carrigan 5/6 Intermediate School, Harry M. Bailey Middle School, and West Haven High School.
Ownership History
Date
Name
Owned For
Owner Type
Purchase Details
Closed on
Aug 13, 2025
Sold by
Orourke John and Hagedorn Walter
Bought by
Jwal Llc
Current Estimated Value
Purchase Details
Closed on
Jan 5, 2022
Sold by
Ferrie Vincent A and Ferrie Benjamin
Bought by
Orourke John and Hagedorn Walter
Purchase Details
Closed on
Jan 27, 2000
Sold by
Ferrie Anastasia C
Bought by
Ferrie Vincent A and Ferrie Benjamin
Home Financials for this Owner
Home Financials are based on the most recent Mortgage that was taken out on this home.
Original Mortgage
$90,000
Interest Rate
7.83%
Mortgage Type
Commercial
Create a Home Valuation Report for This Property
The Home Valuation Report is an in-depth analysis detailing your home's value as well as a comparison with similar homes in the area
Home Values in the Area
Average Home Value in this Area
Purchase History
| Date | Buyer | Sale Price | Title Company |
|---|---|---|---|
| Jwal Llc | -- | -- | |
| Orourke John | $400,000 | None Available | |
| Orourke John | $400,000 | None Available | |
| Ferrie Vincent A | $100,000 | -- | |
| Ferrie Vincent A | $100,000 | -- |
Source: Public Records
Mortgage History
| Date | Status | Borrower | Loan Amount |
|---|---|---|---|
| Previous Owner | Ferrie Vincent A | $90,000 |
Source: Public Records
Tax History Compared to Growth
Tax History
| Year | Tax Paid | Tax Assessment Tax Assessment Total Assessment is a certain percentage of the fair market value that is determined by local assessors to be the total taxable value of land and additions on the property. | Land | Improvement |
|---|---|---|---|---|
| 2025 | $5,910 | $171,150 | $78,400 | $92,750 |
| 2024 | $4,225 | $87,080 | $29,610 | $57,470 |
| 2023 | $4,050 | $87,080 | $29,610 | $57,470 |
| 2022 | $3,971 | $87,080 | $29,610 | $57,470 |
| 2021 | $3,971 | $87,080 | $29,610 | $57,470 |
| 2020 | $3,674 | $72,800 | $26,320 | $46,480 |
| 2019 | $3,543 | $72,800 | $26,320 | $46,480 |
| 2018 | $3,513 | $72,800 | $26,320 | $46,480 |
| 2017 | $3,324 | $72,800 | $26,320 | $46,480 |
| 2016 | $3,317 | $72,800 | $26,320 | $46,480 |
| 2015 | $3,067 | $76,020 | $32,900 | $43,120 |
| 2014 | $3,048 | $76,020 | $32,900 | $43,120 |
Source: Public Records
Map
Nearby Homes
- 22 Thill St
- 43 Clifton St
- 25 Richards St
- 941 Campbell Ave
- 170 Wood St
- 1014 Campbell Ave Unit 14
- 194 Ella T Grasso Blvd
- 14 Homestead Ave
- 29 Abner St
- 484 1st Ave Unit 6
- 28 Wharton St
- 682 2nd Ave
- 104 Terrace Ave
- 211 Kimberly Ave
- 677 Washington Ave
- 24 George St
- 148 Plymouth St
- 133 Plymouth St
- 246 Elm St
- 141 Center St