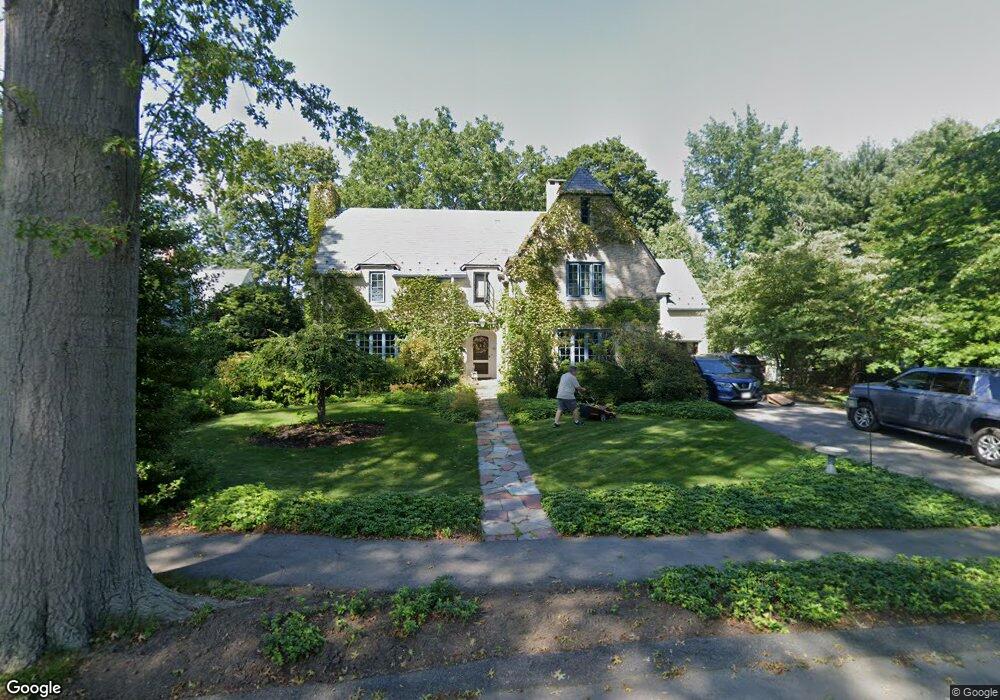
38 Sturtevant Rd Quincy, MA 02169
Quincy Center NeighborhoodEstimated Value: $1,313,378 - $1,553,000
4
Beds
3
Baths
3,715
Sq Ft
$386/Sq Ft
Est. Value
About This Home
This home is located at 38 Sturtevant Rd, Quincy, MA 02169 and is currently estimated at $1,435,095, approximately $386 per square foot. 38 Sturtevant Rd is a home located in Norfolk County with nearby schools including Charles A. Bernazzani Elementary School, Central Middle School, and Quincy High School.
Ownership History
Date
Name
Owned For
Owner Type
Purchase Details
Closed on
Dec 3, 2015
Sold by
Stetson-Dwyer Janet and Dwyer William M
Bought by
38 Sturtevant Road Rt
Current Estimated Value
Purchase Details
Closed on
Nov 16, 1994
Sold by
Sorkin Stanley S and Sorkin Marilyn H
Bought by
Dwyer Jane S and Dwyer William M
Home Financials for this Owner
Home Financials are based on the most recent Mortgage that was taken out on this home.
Original Mortgage
$288,000
Interest Rate
8.9%
Mortgage Type
Purchase Money Mortgage
Create a Home Valuation Report for This Property
The Home Valuation Report is an in-depth analysis detailing your home's value as well as a comparison with similar homes in the area
Home Values in the Area
Average Home Value in this Area
Purchase History
| Date | Buyer | Sale Price | Title Company |
|---|---|---|---|
| 38 Sturtevant Road Rt | -- | -- | |
| Dwyer Jane S | $360,000 | -- |
Source: Public Records
Mortgage History
| Date | Status | Borrower | Loan Amount |
|---|---|---|---|
| Previous Owner | Dwyer Jane S | $288,000 |
Source: Public Records
Tax History Compared to Growth
Tax History
| Year | Tax Paid | Tax Assessment Tax Assessment Total Assessment is a certain percentage of the fair market value that is determined by local assessors to be the total taxable value of land and additions on the property. | Land | Improvement |
|---|---|---|---|---|
| 2025 | $14,924 | $1,294,400 | $324,500 | $969,900 |
| 2024 | $13,997 | $1,242,000 | $309,900 | $932,100 |
| 2023 | $12,969 | $1,165,200 | $283,300 | $881,900 |
| 2022 | $14,418 | $1,203,500 | $259,100 | $944,400 |
| 2021 | $13,298 | $1,095,400 | $259,100 | $836,300 |
| 2020 | $13,446 | $1,081,700 | $247,500 | $834,200 |
| 2019 | $12,670 | $1,009,600 | $234,500 | $775,100 |
| 2018 | $11,030 | $826,800 | $234,500 | $592,300 |
| 2017 | $10,941 | $772,100 | $224,200 | $547,900 |
| 2016 | $10,290 | $716,600 | $214,300 | $502,300 |
| 2015 | $9,821 | $672,700 | $214,300 | $458,400 |
| 2014 | $9,155 | $616,100 | $204,900 | $411,200 |
Source: Public Records
Map
Nearby Homes
- 312 Adams St
- 57 Willow Ave
- 77 Adams St Unit 610
- 1025 Hancock St Unit 12K
- 1025 Hancock St Unit 1F
- 1025 Hancock St Unit 1K
- 14 Priscilla Ln
- 89 Puritan Dr
- 118 Dimmock St
- 29 Oval Rd
- 1 Adams St Unit 502
- 25 Carrolls Ln
- 40 Greenleaf St Unit 102
- 165 Old Colony Ave Unit A
- 54 Hudson St
- 20 Whitney Rd
- 20 Whitney Rd Unit 307
- 20 Whitney Rd Unit 101
- 129 Grand View Ave
- 73 Cranch St Unit 73