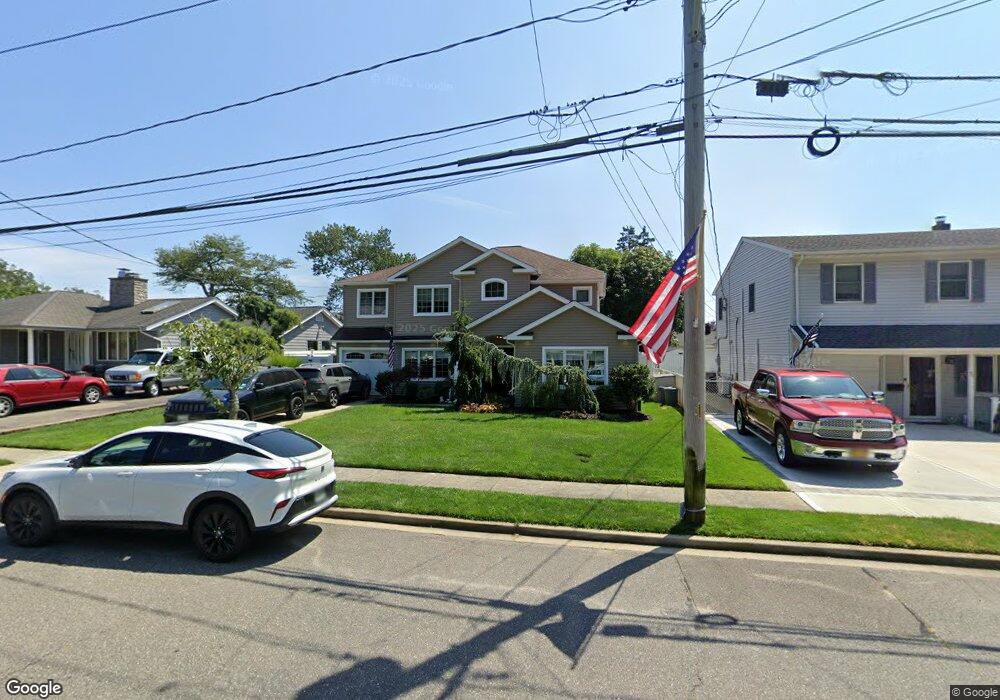
38 Sycamore St Massapequa, NY 11758
Estimated Value: $704,966 - $974,000
--
Bed
1
Bath
2,202
Sq Ft
$399/Sq Ft
Est. Value
About This Home
This home is located at 38 Sycamore St, Massapequa, NY 11758 and is currently estimated at $878,742, approximately $399 per square foot. 38 Sycamore St is a home located in Nassau County with nearby schools including Massapequa High School - Ames Campus, Berner Middle School, and Massapequa High School.
Ownership History
Date
Name
Owned For
Owner Type
Purchase Details
Closed on
Mar 20, 2020
Sold by
Kantor Catherine E and Kantor Perry S
Bought by
Kantor Catherine E and Kantor Perry S
Current Estimated Value
Purchase Details
Closed on
Oct 26, 2015
Sold by
James Catherine E and Stegeman Catherine E
Bought by
Stegeman Catherine E and Stegeman James Catherine
Purchase Details
Closed on
Feb 20, 1995
Sold by
Swanson Elizabeth Est
Bought by
James Mark and James Catherine
Home Financials for this Owner
Home Financials are based on the most recent Mortgage that was taken out on this home.
Original Mortgage
$142,000
Interest Rate
9.09%
Create a Home Valuation Report for This Property
The Home Valuation Report is an in-depth analysis detailing your home's value as well as a comparison with similar homes in the area
Home Values in the Area
Average Home Value in this Area
Purchase History
| Date | Buyer | Sale Price | Title Company |
|---|---|---|---|
| Kantor Catherine E | -- | None Available | |
| Stegeman Catherine E | -- | None Available | |
| James Mark | $155,000 | -- |
Source: Public Records
Mortgage History
| Date | Status | Borrower | Loan Amount |
|---|---|---|---|
| Closed | James Mark | $142,000 |
Source: Public Records
Tax History Compared to Growth
Tax History
| Year | Tax Paid | Tax Assessment Tax Assessment Total Assessment is a certain percentage of the fair market value that is determined by local assessors to be the total taxable value of land and additions on the property. | Land | Improvement |
|---|---|---|---|---|
| 2025 | $15,329 | $568 | $188 | $380 |
| 2024 | $4,727 | $568 | $188 | $380 |
| 2023 | $15,240 | $568 | $188 | $380 |
| 2022 | $15,240 | $568 | $188 | $380 |
| 2021 | $15,453 | $547 | $181 | $366 |
| 2020 | $15,659 | $1,085 | $611 | $474 |
| 2019 | $3,415 | $636 | $611 | $25 |
| 2018 | $4,956 | $636 | $0 | $0 |
| 2017 | $4,956 | $636 | $611 | $25 |
| 2016 | $8,050 | $636 | $611 | $25 |
| 2015 | $2,777 | $636 | $611 | $25 |
| 2014 | $2,777 | $636 | $611 | $25 |
| 2013 | $2,525 | $636 | $611 | $25 |
Source: Public Records
Map
Nearby Homes
- 17 Linden St
- 54 Chestnut St
- 28 Grove St
- 3969 Marlow Ct
- 3945 Hickory St
- 2067 Jackson Ave
- 1872 Park Dr
- 4037 Park Dr
- 5675 Merrick Rd
- 3861 Hickory St
- 63 Pennsylvania Ave
- 243 Seaford Ave
- 36 Michigan Ave
- 3937 John Ln
- 51 Michigan Ave
- 230 W End Ave
- 138 Saint Marks Place
- 4 Sutton Place
- 135 Ocean Ave
- 4060 Clark St