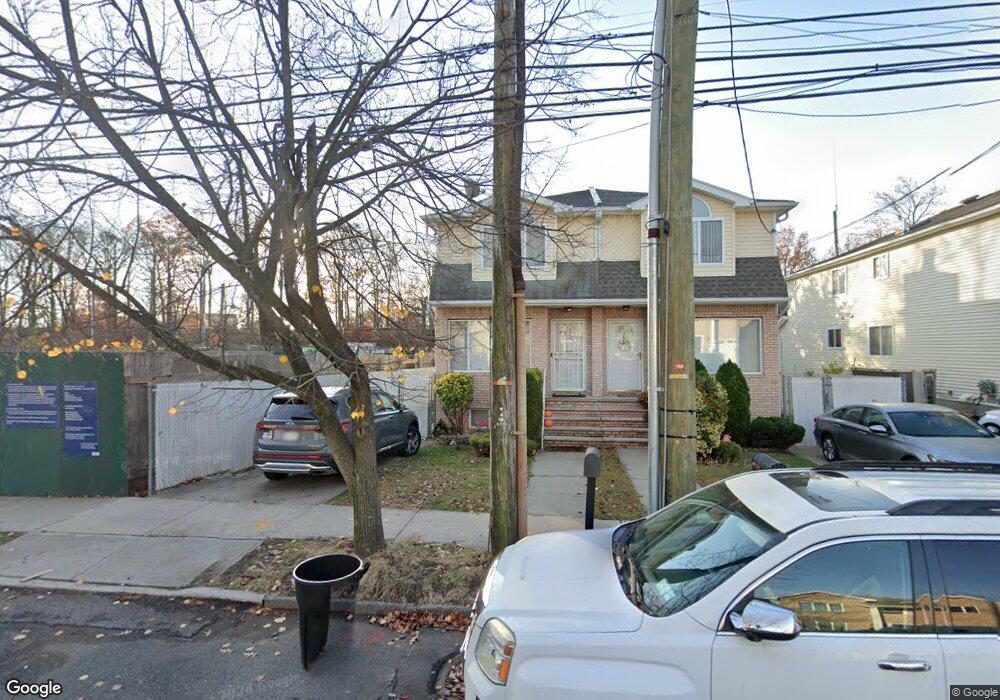
38 Sylvia St Staten Island, NY 10312
Eltingville NeighborhoodEstimated Value: $654,000 - $795,000
3
Beds
2
Baths
1,240
Sq Ft
$573/Sq Ft
Est. Value
About This Home
This home is located at 38 Sylvia St, Staten Island, NY 10312 and is currently estimated at $710,165, approximately $572 per square foot. 38 Sylvia St is a home located in Richmond County with nearby schools including P.S. 42 The Eltingville School, I.S. 007 Elias Bernstein, and Tottenville High School.
Ownership History
Date
Name
Owned For
Owner Type
Purchase Details
Closed on
Oct 7, 2020
Sold by
Crocco Marie
Bought by
Crocco Marie
Current Estimated Value
Purchase Details
Closed on
Jul 9, 2008
Sold by
Crocco Marie
Bought by
Crocco Marie
Home Financials for this Owner
Home Financials are based on the most recent Mortgage that was taken out on this home.
Original Mortgage
$544,185
Interest Rate
5.45%
Mortgage Type
Reverse Mortgage Home Equity Conversion Mortgage
Purchase Details
Closed on
Jul 7, 2000
Sold by
Crocco Marie
Bought by
Crocco Marie
Purchase Details
Closed on
Mar 31, 1998
Sold by
Thirty Two Inc
Bought by
Crocco Marie
Home Financials for this Owner
Home Financials are based on the most recent Mortgage that was taken out on this home.
Original Mortgage
$134,900
Interest Rate
7.04%
Purchase Details
Closed on
Dec 4, 1996
Sold by
Marini Vincent
Bought by
Thirty Two Inc
Create a Home Valuation Report for This Property
The Home Valuation Report is an in-depth analysis detailing your home's value as well as a comparison with similar homes in the area
Home Values in the Area
Average Home Value in this Area
Purchase History
| Date | Buyer | Sale Price | Title Company |
|---|---|---|---|
| Crocco Marie | -- | None Listed On Document | |
| Crocco Marie | -- | None Available | |
| Crocco Marie | -- | Commonwealth Land Title Ins | |
| Crocco Marie | $187,500 | -- | |
| Thirty Two Inc | $68,000 | -- |
Source: Public Records
Mortgage History
| Date | Status | Borrower | Loan Amount |
|---|---|---|---|
| Previous Owner | Crocco Marie | $544,185 | |
| Previous Owner | Crocco Marie | $134,900 |
Source: Public Records
Tax History Compared to Growth
Tax History
| Year | Tax Paid | Tax Assessment Tax Assessment Total Assessment is a certain percentage of the fair market value that is determined by local assessors to be the total taxable value of land and additions on the property. | Land | Improvement |
|---|---|---|---|---|
| 2025 | $2,648 | $42,480 | $6,538 | $35,942 |
| 2024 | $2,660 | $37,020 | $7,078 | $29,942 |
| 2023 | $5,304 | $31,450 | $6,338 | $25,112 |
| 2022 | $2,460 | $31,740 | $7,860 | $23,880 |
| 2021 | $2,571 | $31,920 | $7,860 | $24,060 |
| 2020 | $2,419 | $30,660 | $7,860 | $22,800 |
| 2019 | $2,405 | $33,300 | $7,860 | $25,440 |
| 2018 | $1,523 | $26,208 | $6,745 | $19,463 |
| 2017 | $1,746 | $26,208 | $6,825 | $19,383 |
| 2016 | $1,703 | $26,011 | $7,265 | $18,746 |
| 2015 | $1,383 | $24,539 | $6,338 | $18,201 |
| 2014 | $1,383 | $23,150 | $6,125 | $17,025 |
Source: Public Records
Map
Nearby Homes
- 42 Sylvia St
- 75 Chesebrough St
- 6 Waimer Place
- 47 Village Ln Unit B
- 69 Stuyvesant Ave
- 15 Bovanizer St
- 4665 Amboy Rd
- 632 Wilson Ave
- 229 Mosely Ave
- 160 Serrell Ave
- 97 Lyndale Ave
- 420 Getz Ave
- 82 Woods of Arden Rd
- 22 May Place
- 475 Beach Rd
- 333 Pacific Ave
- 102 Seguine Place
- 0 Oakdale St
- 9 Eagan Ave
- 31 Fingal St