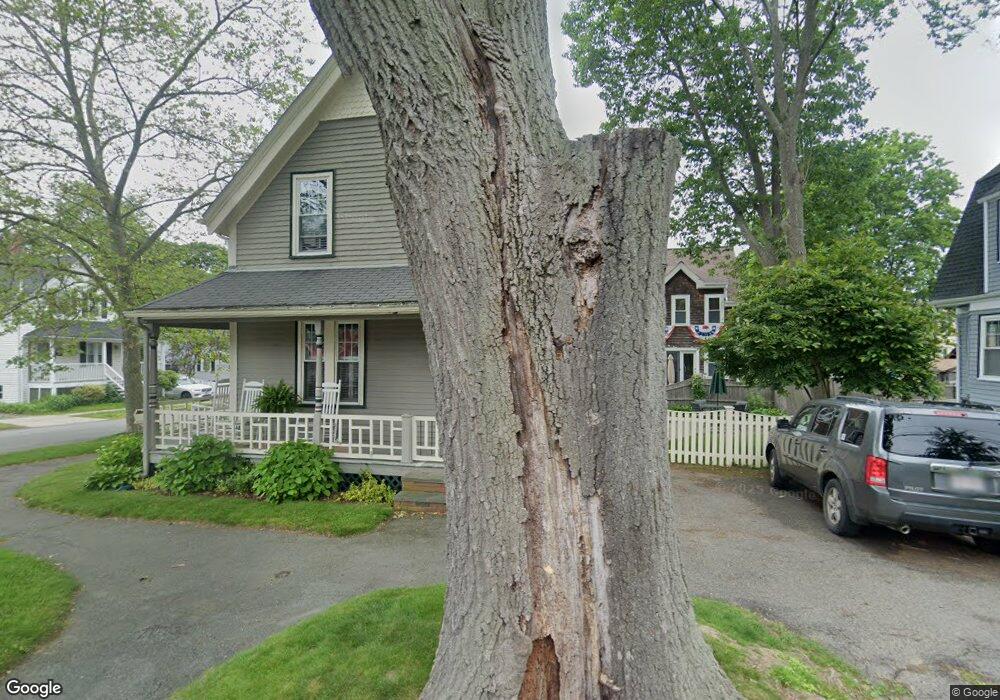
38 Thomas Rd Swampscott, MA 01907
Estimated Value: $705,776 - $765,000
3
Beds
2
Baths
1,321
Sq Ft
$554/Sq Ft
Est. Value
About This Home
This home is located at 38 Thomas Rd, Swampscott, MA 01907 and is currently estimated at $731,444, approximately $553 per square foot. 38 Thomas Rd is a home located in Essex County with nearby schools including Swampscott Middle School and Swampscott High School.
Ownership History
Date
Name
Owned For
Owner Type
Purchase Details
Closed on
Mar 16, 2007
Sold by
Stratton Jennifer L and Stratton Seth N
Bought by
Bosken Robert J and Bosken Lindsay A
Current Estimated Value
Home Financials for this Owner
Home Financials are based on the most recent Mortgage that was taken out on this home.
Original Mortgage
$319,600
Interest Rate
6.4%
Mortgage Type
Purchase Money Mortgage
Purchase Details
Closed on
Jan 7, 2005
Sold by
Hill Michael E and Hill Nancy Jean
Bought by
Stratton Seth N and Stratton Jennifer L
Purchase Details
Closed on
Jul 31, 1997
Sold by
Brothers Ronald A and Brothers Theresa E
Bought by
Hill Michael E and Hill Nancy J
Purchase Details
Closed on
Jul 30, 1993
Sold by
Gorham Francis X
Bought by
Ellis Brothers Ronald A and Ellis Brothers Theresa
Purchase Details
Closed on
Dec 20, 1989
Sold by
Davidson Martha E
Bought by
Gorham Francis
Create a Home Valuation Report for This Property
The Home Valuation Report is an in-depth analysis detailing your home's value as well as a comparison with similar homes in the area
Home Values in the Area
Average Home Value in this Area
Purchase History
| Date | Buyer | Sale Price | Title Company |
|---|---|---|---|
| Bosken Robert J | $399,500 | -- | |
| Bosken Robert J | $399,500 | -- | |
| Stratton Seth N | $420,000 | -- | |
| Stratton Seth N | $420,000 | -- | |
| Hill Michael E | $175,500 | -- | |
| Hill Michael E | $175,500 | -- | |
| Ellis Brothers Ronald A | $147,000 | -- | |
| Brothers Ronald A | $147,000 | -- | |
| Gorham Francis | $145,200 | -- |
Source: Public Records
Mortgage History
| Date | Status | Borrower | Loan Amount |
|---|---|---|---|
| Open | Gorham Francis | $312,200 | |
| Closed | Gorham Francis | $319,600 |
Source: Public Records
Tax History
| Year | Tax Paid | Tax Assessment Tax Assessment Total Assessment is a certain percentage of the fair market value that is determined by local assessors to be the total taxable value of land and additions on the property. | Land | Improvement |
|---|---|---|---|---|
| 2025 | $7,637 | $665,800 | $309,400 | $356,400 |
| 2024 | $7,418 | $645,600 | $294,400 | $351,200 |
| 2023 | $6,869 | $585,100 | $264,200 | $320,900 |
| 2022 | $6,421 | $500,500 | $226,400 | $274,100 |
| 2021 | $6,620 | $479,700 | $211,300 | $268,400 |
| 2020 | $6,484 | $453,400 | $188,700 | $264,700 |
| 2019 | $6,604 | $434,500 | $169,800 | $264,700 |
| 2018 | $6,408 | $400,500 | $154,700 | $245,800 |
| 2017 | $6,490 | $371,900 | $144,900 | $227,000 |
| 2016 | $6,445 | $371,900 | $144,900 | $227,000 |
| 2015 | $6,378 | $371,900 | $144,900 | $227,000 |
| 2014 | $5,911 | $316,100 | $120,800 | $195,300 |
Source: Public Records
Map
Nearby Homes
- 40 Andrew Rd
- 108-110 Burrill St Unit 1
- 146 Burrill St
- 11 Boynton St Unit 104
- 11 Boynton St Unit 101
- 11 Boynton St Unit 102
- 11 Boynton St Unit 103
- 11 Boynton St Unit 204
- 28 Claremont Terrace Unit 6
- 80 Norfolk Ave Unit 1
- 106 Norfolk Ave
- 32 Kings Beach Terrace
- 178 Norfolk Ave
- 64 Stetson Ave
- 97 Seymour Ave
- 1 Bond St
- 40 Buena Vista St
- 59 Essex St Unit 59B
- 79 Brookline St
- 51 Mountwood Rd
Your Personal Tour Guide
Ask me questions while you tour the home.