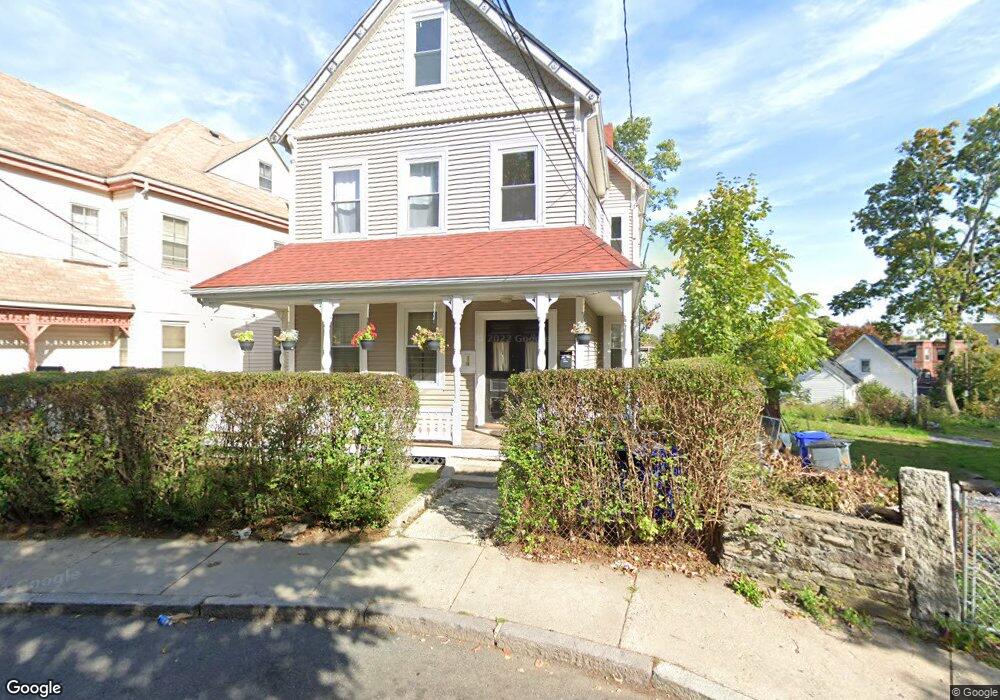
38 Thornton St Roxbury, MA 02119
Fort Hill NeighborhoodEstimated Value: $1,050,598 - $1,084,000
5
Beds
3
Baths
3,153
Sq Ft
$337/Sq Ft
Est. Value
About This Home
This home is located at 38 Thornton St, Roxbury, MA 02119 and is currently estimated at $1,062,400, approximately $336 per square foot. 38 Thornton St is a home located in Suffolk County with nearby schools including City on a Hill Charter Public School and Paige Academy.
Ownership History
Date
Name
Owned For
Owner Type
Purchase Details
Closed on
Jun 17, 2013
Sold by
Turner Valarie L
Bought by
Turner Valarie L
Current Estimated Value
Purchase Details
Closed on
Mar 23, 2012
Sold by
Francis Levon
Bought by
Francis Valarie L
Purchase Details
Closed on
Dec 16, 1993
Sold by
Cooke Charles R
Bought by
Turner Valerie L
Create a Home Valuation Report for This Property
The Home Valuation Report is an in-depth analysis detailing your home's value as well as a comparison with similar homes in the area
Home Values in the Area
Average Home Value in this Area
Purchase History
| Date | Buyer | Sale Price | Title Company |
|---|---|---|---|
| Turner Valarie L | -- | -- | |
| Francis Valarie L | -- | -- | |
| Turner Valerie L | $140,000 | -- |
Source: Public Records
Mortgage History
| Date | Status | Borrower | Loan Amount |
|---|---|---|---|
| Previous Owner | Turner Valerie L | $250,000 | |
| Previous Owner | Turner Valerie L | $50,000 | |
| Previous Owner | Turner Valerie L | $70,000 | |
| Previous Owner | Turner Valerie L | $95,000 |
Source: Public Records
Tax History Compared to Growth
Tax History
| Year | Tax Paid | Tax Assessment Tax Assessment Total Assessment is a certain percentage of the fair market value that is determined by local assessors to be the total taxable value of land and additions on the property. | Land | Improvement |
|---|---|---|---|---|
| 2025 | $9,947 | $859,000 | $301,500 | $557,500 |
| 2024 | $8,881 | $814,800 | $221,900 | $592,900 |
| 2023 | $8,415 | $783,500 | $213,400 | $570,100 |
| 2022 | $7,750 | $712,300 | $194,000 | $518,300 |
| 2021 | $7,103 | $665,700 | $181,300 | $484,400 |
| 2020 | $6,808 | $644,700 | $178,300 | $466,400 |
| 2019 | $6,354 | $602,800 | $136,500 | $466,300 |
| 2018 | $5,851 | $558,300 | $136,500 | $421,800 |
| 2017 | $5,855 | $552,900 | $136,500 | $416,400 |
| 2016 | $4,562 | $414,708 | $114,660 | $300,048 |
| 2015 | $4,120 | $340,200 | $104,500 | $235,700 |
| 2014 | $3,765 | $299,300 | $104,500 | $194,800 |
Source: Public Records
Map
Nearby Homes
- 9 W Cedar St Unit 1
- 38 Juniper St
- 37 Regent St Unit 2
- 31 Dorr St
- 51 Saint James St
- 49 Norfolk St
- 4 Fort Ave Unit 2
- 10 Linwood St
- 94 Walnut Ave
- 27 Dudley St
- 63 Beech Glen St
- 9-45 Vale St
- 22 Rockville Park
- 20 Rockville Park
- 51 Beech Glen St Unit 3
- 16 Mayfair St
- 59 Fort Ave
- 2856 Washington St
- 8 Brinton St Unit 2
- 10 Rockland St Unit 4
- 38 Thornton St Unit 1
- 36 Thornton St
- 1 Cedar Square
- 32 Thornton St
- 32 Thornton St Unit 2
- 34 Juniper St Unit 36
- 34 Juniper St Unit 36
- 34 Juniper St Unit 36
- 34 Juniper St Unit 1
- 34 Juniper St Unit 3
- 34 Juniper St Unit 2
- 30 Juniper St
- 30 Juniper St Unit 1
- 26 Juniper St
- 38 Juniper St Unit 1
- 22 Juniper St
- 28 Thornton St
- 41 Thornton St Unit 2
- 42 Juniper St
- 42 Juniper St Unit 1