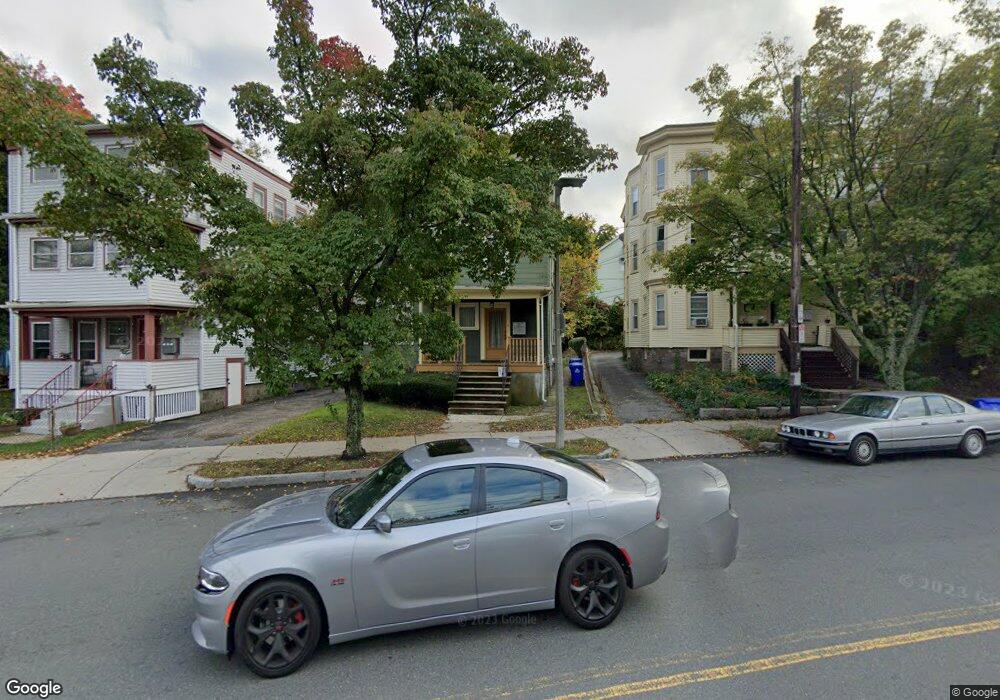
38 Tremont St Brighton, MA 02135
Brighton NeighborhoodEstimated Value: $1,288,000 - $1,492,000
6
Beds
3
Baths
3,144
Sq Ft
$451/Sq Ft
Est. Value
About This Home
great three bedroom one bathroom unit located in Brighton
Ownership History
Date
Name
Owned For
Owner Type
Purchase Details
Closed on
Jul 6, 1998
Sold by
Hoo Wing Soo
Bought by
Hoo Paul S and Hoo Faye W
Current Estimated Value
Home Financials for this Owner
Home Financials are based on the most recent Mortgage that was taken out on this home.
Original Mortgage
$165,000
Outstanding Balance
$33,884
Interest Rate
7.04%
Mortgage Type
Purchase Money Mortgage
Estimated Equity
$1,383,783
Create a Home Valuation Report for This Property
The Home Valuation Report is an in-depth analysis detailing your home's value as well as a comparison with similar homes in the area
Home Values in the Area
Average Home Value in this Area
Purchase History
| Date | Buyer | Sale Price | Title Company |
|---|---|---|---|
| Hoo Paul S | $20,000 | -- | |
| Hoo Paul S | $20,000 | -- | |
| Hoo Paul S | $20,000 | -- |
Source: Public Records
Mortgage History
| Date | Status | Borrower | Loan Amount |
|---|---|---|---|
| Open | Hoo Paul S | $165,000 |
Source: Public Records
Property History
| Date | Event | Price | List to Sale | Price per Sq Ft |
|---|---|---|---|---|
| 02/10/2025 02/10/25 | Off Market | $3,400 | -- | -- |
| 01/16/2025 01/16/25 | For Rent | -- | -- | -- |
| 10/08/2024 10/08/24 | Off Market | $3,400 | -- | -- |
| 09/01/2024 09/01/24 | For Rent | $3,400 | -- | -- |
Tax History Compared to Growth
Tax History
| Year | Tax Paid | Tax Assessment Tax Assessment Total Assessment is a certain percentage of the fair market value that is determined by local assessors to be the total taxable value of land and additions on the property. | Land | Improvement |
|---|---|---|---|---|
| 2025 | $14,110 | $1,218,500 | $333,000 | $885,500 |
| 2024 | $12,818 | $1,176,000 | $320,600 | $855,400 |
| 2023 | $11,696 | $1,089,000 | $296,900 | $792,100 |
| 2022 | $11,499 | $1,056,900 | $288,200 | $768,700 |
| 2021 | $11,056 | $1,036,200 | $282,500 | $753,700 |
| 2020 | $9,598 | $908,900 | $254,400 | $654,500 |
| 2019 | $8,953 | $849,400 | $196,000 | $653,400 |
| 2018 | $8,476 | $808,800 | $196,000 | $612,800 |
| 2017 | $8,157 | $770,300 | $196,000 | $574,300 |
| 2016 | $7,703 | $700,300 | $196,000 | $504,300 |
| 2015 | $7,471 | $616,900 | $199,400 | $417,500 |
| 2014 | -- | $544,500 | $199,400 | $345,100 |
Source: Public Records
Map
Nearby Homes
- 8 Tremont Place
- 21 Glenley Terrace
- 18 Breck Ave Unit 18
- 427-435 Faneuil St Unit R4
- 99 Tremont St Unit 105
- 99 Tremont St Unit 413
- 14 Atkins St
- 39 Champney St
- 22 Bigelow St
- 121 Tremont St Unit B1
- 34 Larch St Unit 34
- 32-34 Larch St
- 32 Larch St Unit 34
- 365 Faneuil St Unit 2
- 142 Kenrick St Unit 36
- 69 Presentation Rd
- 106 Farlow Rd
- 21 Upcrest Rd
- 116 Lake Shore Rd Unit 4
- 12 Mina Way
- 38 Tremont St Unit 1
- 36 Tremont St
- 36 Tremont St Unit 3
- 36 Tremont St
- 36 Tremont St Unit 1
- 40 Tremont St
- 40 Tremont St Unit 2
- 40 Tremont St Unit 1
- 40 Tremont St Unit 3
- 42 Tremont St Unit 3
- 42 Tremont St Unit 1
- 42 Tremont St
- 71 Nonantum St
- 71 Nonantum St Unit 2
- 46 Tremont St
- 46 Tremont St Unit 2
- 46 Tremont St
- 46 Tremont St Unit 1
- 73 Nonantum St Unit 73A
- 73 Nonantum St Unit 2