38 Turner Rd Marblehead, MA 01945
Estimated Value: $694,000 - $787,166
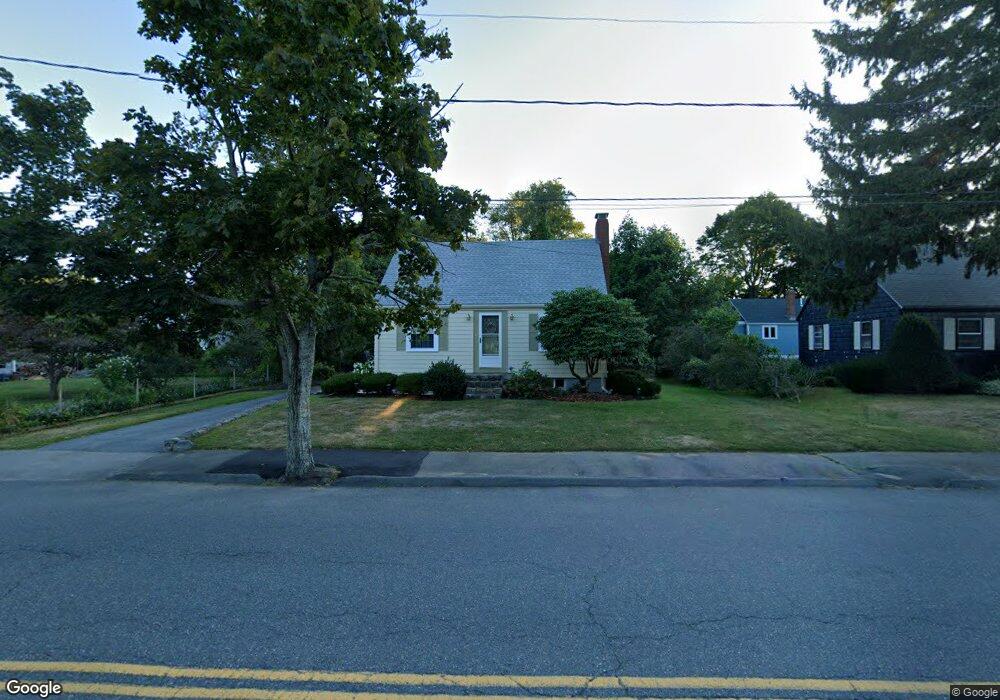
About This Home
This home is located at 38 Turner Rd, Marblehead, MA 01945 and is currently estimated at $756,292, approximately $617 per square foot. 38 Turner Rd is a home located in Essex County with nearby schools including Marblehead High School, Marblehead Community Charter Public School, and Tower School.
Ownership History
We collect this data history from publicly available records. To have your information removed, we recommend requesting removal directly through your county’s website.
Purchase Details
Home Values in the Area
Average Home Value in this Area
Purchase History
We collect this data history from publicly available records. To have your information removed, we recommend requesting removal directly through your county’s website.
| Date | Buyer | Sale Price | Title Company |
|---|---|---|---|
| -- | -- | ||
| -- | -- | ||
| -- | -- |
Mortgage History
We collect this data history from publicly available records. To have your information removed, we recommend requesting removal directly through your county’s website.
| Date | Status | Borrower | Loan Amount |
|---|---|---|---|
| Previous Owner | $30,000 |
Tax History
We collect this data history from publicly available records. To have your information removed, we recommend requesting removal directly through your county’s website.
| Year | Tax Paid | Tax Assessment Tax Assessment Total Assessment is a certain percentage of the fair market value that is determined by local assessors to be the total taxable value of land and additions on the property. | Land | Improvement |
|---|---|---|---|---|
| 2025 | $7,142 | $789,200 | $619,500 | $169,700 |
| 2024 | $6,295 | $702,600 | $592,000 | $110,600 |
| 2023 | $6,876 | $687,600 | $564,400 | $123,200 |
| 2022 | $6,136 | $583,300 | $461,200 | $122,100 |
| 2021 | $5,862 | $562,600 | $440,500 | $122,100 |
| 2020 | $5,654 | $544,200 | $440,500 | $103,700 |
| 2019 | $5,389 | $501,800 | $399,200 | $102,600 |
| 2018 | $5,227 | $474,300 | $371,700 | $102,600 |
| 2017 | $4,767 | $433,000 | $330,400 | $102,600 |
| 2016 | $4,653 | $419,200 | $316,600 | $102,600 |
| 2015 | $4,434 | $400,200 | $302,900 | $97,300 |
| 2014 | $3,956 | $356,700 | $261,600 | $95,100 |
Map
- 5 Ramsay Rd
- 55 Lincoln Ave
- 262 W Shore Dr
- 21 Shepard St
- 98 Evans Rd
- 78 Garfield St
- 155 Green St Unit 4
- 57 Overlook Rd
- 58 Jersey St
- 66 Overlook Rd
- 16 Liberty Rd
- 69 Kenneth Rd
- 16 Evans Rd Unit 2
- 149 Elm St
- 197A W Shore Dr Unit A
- 55 Stony Brook Rd
- 83 Pleasant St Unit 3
- 66 Pleasant St Unit 2
- 64 Pleasant St Unit A
- 31 Mugford St
Ask me questions while you tour the home.