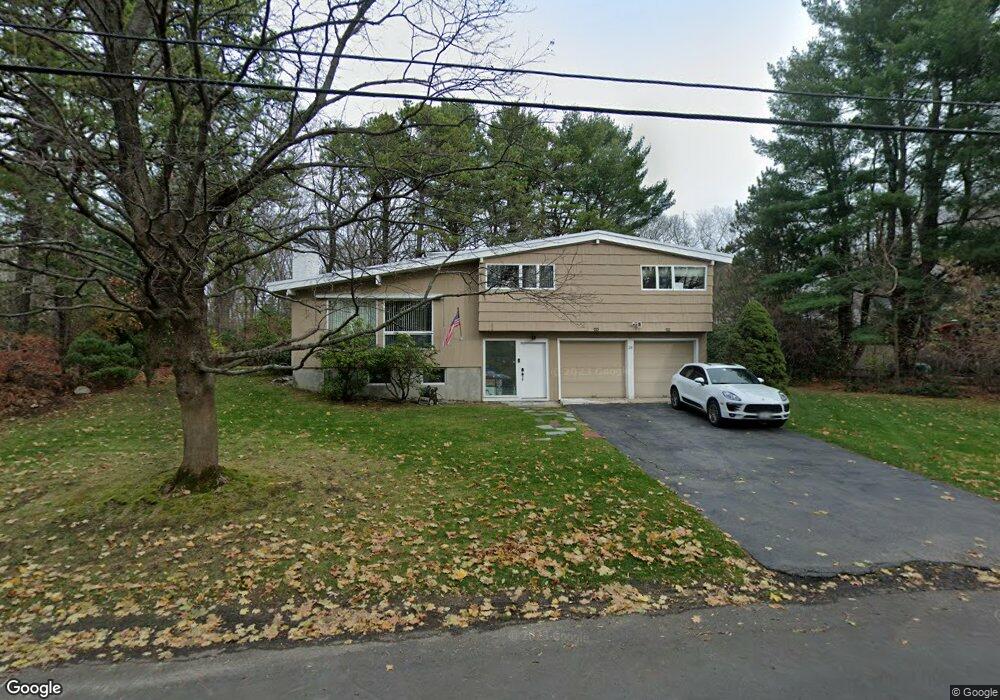
38 Tyler Rd Lexington, MA 02420
Countryside NeighborhoodEstimated Value: $1,353,534 - $1,720,000
3
Beds
2
Baths
1,763
Sq Ft
$850/Sq Ft
Est. Value
About This Home
Private view overlooking the front and back yard single house rental at Sun Valley neighborhood. 3 bedrooms 2 baths contemporize multi level style. Features hardwood floor through out, newer windows, C/A, sprinklers system and 2 car garages. Freshly painted in & out.
Ownership History
Date
Name
Owned For
Owner Type
Purchase Details
Closed on
Jul 30, 2004
Sold by
Bacchialoni Francesco L and Bacchialoni Rita S
Bought by
Chang-Lim Eun Chan and Chang Woo Sok
Current Estimated Value
Home Financials for this Owner
Home Financials are based on the most recent Mortgage that was taken out on this home.
Original Mortgage
$475,000
Outstanding Balance
$240,688
Interest Rate
6.33%
Mortgage Type
Purchase Money Mortgage
Estimated Equity
$1,258,446
Create a Home Valuation Report for This Property
The Home Valuation Report is an in-depth analysis detailing your home's value as well as a comparison with similar homes in the area
Home Values in the Area
Average Home Value in this Area
Purchase History
| Date | Buyer | Sale Price | Title Company |
|---|---|---|---|
| Chang-Lim Eun Chan | $700,000 | -- |
Source: Public Records
Mortgage History
| Date | Status | Borrower | Loan Amount |
|---|---|---|---|
| Open | Chang-Lim Eun Chan | $475,000 |
Source: Public Records
Property History
| Date | Event | Price | List to Sale | Price per Sq Ft |
|---|---|---|---|---|
| 08/16/2024 08/16/24 | For Rent | $4,800 | -- | -- |
Tax History Compared to Growth
Tax History
| Year | Tax Paid | Tax Assessment Tax Assessment Total Assessment is a certain percentage of the fair market value that is determined by local assessors to be the total taxable value of land and additions on the property. | Land | Improvement |
|---|---|---|---|---|
| 2025 | $13,991 | $1,144,000 | $804,000 | $340,000 |
| 2024 | $13,671 | $1,116,000 | $766,000 | $350,000 |
| 2023 | $13,039 | $1,003,000 | $697,000 | $306,000 |
| 2022 | $12,268 | $889,000 | $634,000 | $255,000 |
| 2021 | $12,203 | $848,000 | $604,000 | $244,000 |
| 2020 | $12,013 | $855,000 | $604,000 | $251,000 |
| 2019 | $11,536 | $817,000 | $575,000 | $242,000 |
| 2018 | $11,226 | $785,000 | $548,000 | $237,000 |
| 2017 | $10,157 | $701,000 | $522,000 | $179,000 |
| 2016 | $9,797 | $671,000 | $498,000 | $173,000 |
| 2015 | $9,406 | $633,000 | $452,000 | $181,000 |
| 2014 | $9,011 | $581,000 | $411,000 | $170,000 |
Source: Public Records
Map
Nearby Homes
- 14 Nassau Dr
- 22 Tyler Rd
- 19 Gershon Way Unit 1
- 19 Gershon Way
- 8 Blueberry Ln
- 26 Berkshire Dr
- 16 Winning Farm Rd Unit 16
- 30 Whipple Rd
- 276 High St
- 15 Peachtree Rd
- 21 Derby Dr Unit 21
- 41 Squire Rd
- 257 High St
- 218 Lowell St
- 500 Lexington St Unit 6
- 7 Whipple Rd
- 19 Cox Rd
- 7 Thornberry Rd
- 22 Bryant Rd
- 5 Azalea Rd
- 38 Tyler Rd
- 38 Tyler Rd
- 40 Tyler Rd
- 36 Tyler Rd
- 32 Winchester Dr
- 37 Tyler Rd
- 30 Winchester Dr
- 30 Winchester Dr Unit 30
- 34 Tyler Rd
- 34 Winchester Dr
- 44 Tyler Rd
- 63 Thornberry Rd
- 61 Thornberry Rd
- 67 Thornberry Rd
- 35 Tyler Rd
- 1 Nassau Dr
- 28 Winchester Dr
- 38 Winchester Dr
- 28 Blueberry Ln
- 31 Winchester Dr