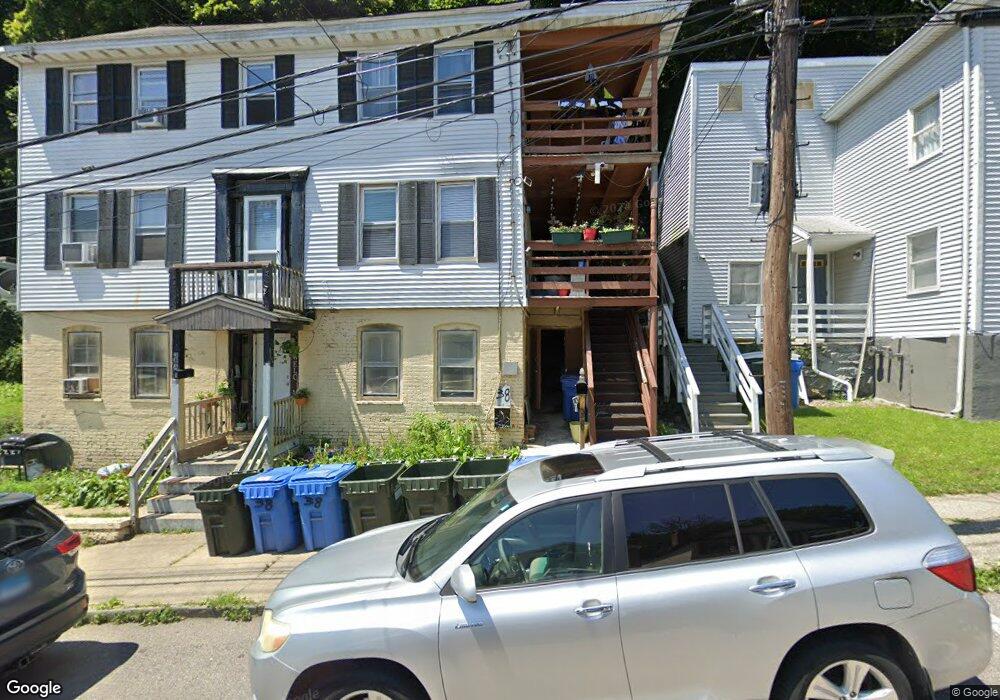
38 Union St Norwich, CT 06360
Central Norwich NeighborhoodEstimated Value: $274,000 - $475,000
4
Beds
3
Baths
2,835
Sq Ft
$123/Sq Ft
Est. Value
About This Home
This home is located at 38 Union St, Norwich, CT 06360 and is currently estimated at $348,212, approximately $122 per square foot. 38 Union St is a home located in New London County with nearby schools including Samuel Huntington Elementary School, Kelly STEAM Magnet Middle School, and Integrated Day Charter School.
Ownership History
Date
Name
Owned For
Owner Type
Purchase Details
Closed on
Dec 27, 2004
Sold by
Cen
Bought by
Martinez Rodolfo
Current Estimated Value
Home Financials for this Owner
Home Financials are based on the most recent Mortgage that was taken out on this home.
Original Mortgage
$144,000
Interest Rate
5.74%
Purchase Details
Closed on
Sep 6, 2002
Sold by
Remondi Kenneth J
Bought by
Jiang Wei and Chen
Home Financials for this Owner
Home Financials are based on the most recent Mortgage that was taken out on this home.
Original Mortgage
$76,328
Interest Rate
6.39%
Create a Home Valuation Report for This Property
The Home Valuation Report is an in-depth analysis detailing your home's value as well as a comparison with similar homes in the area
Home Values in the Area
Average Home Value in this Area
Purchase History
| Date | Buyer | Sale Price | Title Company |
|---|---|---|---|
| Martinez Rodolfo | $180,000 | -- | |
| Martinez Rodolfo | $180,000 | -- | |
| Jiang Wei | $94,000 | -- | |
| Jiang Wei | $94,000 | -- |
Source: Public Records
Mortgage History
| Date | Status | Borrower | Loan Amount |
|---|---|---|---|
| Open | Jiang Wei | $192,000 | |
| Closed | Jiang Wei | $144,000 | |
| Previous Owner | Jiang Wei | $76,328 |
Source: Public Records
Tax History
| Year | Tax Paid | Tax Assessment Tax Assessment Total Assessment is a certain percentage of the fair market value that is determined by local assessors to be the total taxable value of land and additions on the property. | Land | Improvement |
|---|---|---|---|---|
| 2025 | $6,827 | $168,700 | $34,600 | $134,100 |
| 2024 | $6,444 | $168,700 | $34,600 | $134,100 |
| 2023 | $4,514 | $92,800 | $24,300 | $68,500 |
| 2022 | $4,499 | $92,800 | $24,300 | $68,500 |
| 2021 | $4,514 | $92,800 | $24,300 | $68,500 |
| 2020 | $4,498 | $92,800 | $24,300 | $68,500 |
| 2019 | $4,458 | $92,900 | $24,400 | $68,500 |
| 2018 | $4,423 | $91,400 | $28,600 | $62,800 |
| 2017 | $4,455 | $91,400 | $28,600 | $62,800 |
| 2016 | $4,484 | $91,400 | $28,600 | $62,800 |
| 2015 | $4,393 | $91,400 | $28,600 | $62,800 |
| 2014 | $4,198 | $91,400 | $28,600 | $62,800 |
Source: Public Records
Map
Nearby Homes
- 220 Franklin St
- 185 Broadway
- 9 Washington St
- 21 Buckingham Ave
- 34 Buckingham Ave
- 4 Robbins Ct
- 22 Hawthorne St
- 33 Division St
- 35 Cliff St
- 39 Cliff St
- 28 Perkins Ave
- 51 Cliff St Unit 53
- 14 Sturtevant Ave
- 78 Mckinley Ave
- 40 Maple Grove Ave
- 44 Summer St
- 231 Broad St
- 182 Broad St
- 72 N Main St
- 76 Laurel Hill Ave
Your Personal Tour Guide
Ask me questions while you tour the home.