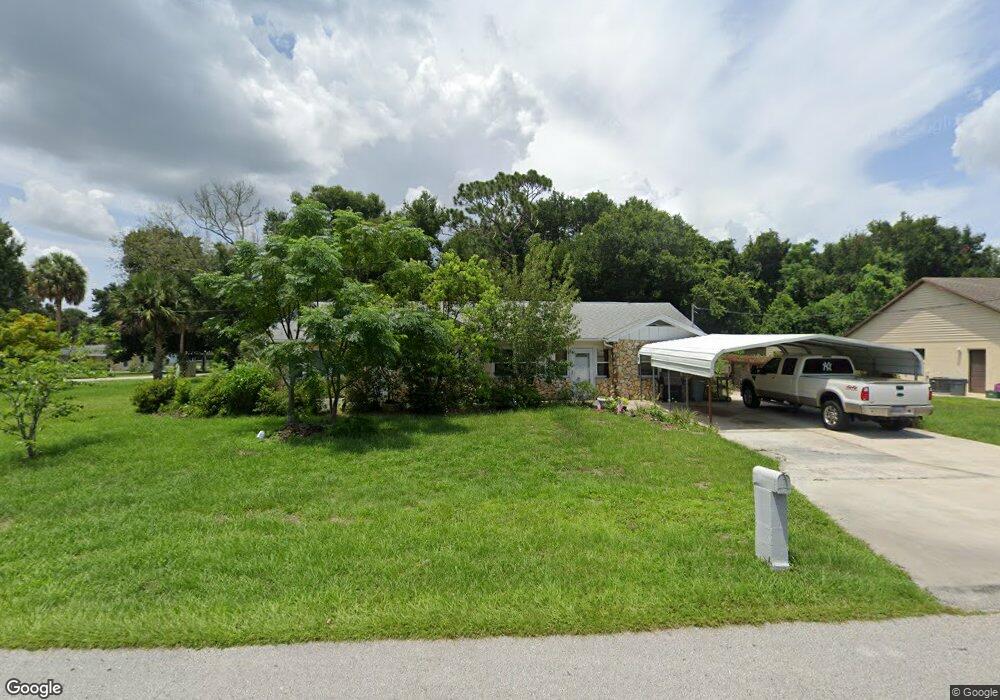
38 Volusia Dr Debary, FL 32713
Estimated Value: $241,000 - $301,000
3
Beds
2
Baths
2,319
Sq Ft
$117/Sq Ft
Est. Value
About This Home
This home is located at 38 Volusia Dr, Debary, FL 32713 and is currently estimated at $270,191, approximately $116 per square foot. 38 Volusia Dr is a home located in Volusia County with nearby schools including Debary Elementary School, River Springs Middle School, and University High School.
Ownership History
Date
Name
Owned For
Owner Type
Purchase Details
Closed on
Oct 12, 2021
Sold by
Prasek Dorothy S and Dorothy S Prasek Living Trust
Bought by
Moore Harley
Current Estimated Value
Home Financials for this Owner
Home Financials are based on the most recent Mortgage that was taken out on this home.
Original Mortgage
$206,196
Outstanding Balance
$186,392
Interest Rate
2.8%
Mortgage Type
FHA
Estimated Equity
$83,799
Purchase Details
Closed on
Feb 9, 2015
Sold by
Prasek Dorothy S
Bought by
Prasek Dorothy S
Create a Home Valuation Report for This Property
The Home Valuation Report is an in-depth analysis detailing your home's value as well as a comparison with similar homes in the area
Home Values in the Area
Average Home Value in this Area
Purchase History
| Date | Buyer | Sale Price | Title Company |
|---|---|---|---|
| Moore Harley | $210,000 | Ability Title Inc | |
| Prasek Dorothy S | -- | Attorney |
Source: Public Records
Mortgage History
| Date | Status | Borrower | Loan Amount |
|---|---|---|---|
| Open | Moore Harley | $206,196 |
Source: Public Records
Tax History
| Year | Tax Paid | Tax Assessment Tax Assessment Total Assessment is a certain percentage of the fair market value that is determined by local assessors to be the total taxable value of land and additions on the property. | Land | Improvement |
|---|---|---|---|---|
| 2026 | $3,004 | $201,051 | -- | -- |
| 2025 | $3,004 | $201,051 | -- | -- |
| 2024 | $2,723 | $195,492 | -- | -- |
| 2023 | $2,723 | $189,799 | $0 | $0 |
| 2022 | $2,658 | $184,271 | $33,060 | $151,211 |
| 2021 | $2,655 | $159,261 | $27,536 | $131,725 |
| 2020 | $2,485 | $144,537 | $19,430 | $125,107 |
| 2019 | $2,442 | $132,764 | $20,010 | $112,754 |
| 2018 | $2,225 | $118,964 | $19,140 | $99,824 |
| 2017 | $2,122 | $106,673 | $17,400 | $89,273 |
| 2016 | $1,894 | $89,940 | $0 | $0 |
| 2015 | -- | $81,069 | $0 | $0 |
| 2014 | -- | $78,512 | $0 | $0 |
Source: Public Records
Map
Nearby Homes
- 29 Volusia Dr
- 29 Lake Dr
- 30 Sanford Ave
- 49 Azalea Dr
- 118 Cedar Springs Cir
- 9 Granada Rd
- 130 Laurianne Rd
- 58 Magnolia Dr
- 150 Serena Rd
- 601 Becklow St
- 11 Aster Dr
- 26 Laurianne Rd
- 9 Poinsettia Dr
- 111 Colomba Rd
- 112 Colomba Rd
- 157 Plantation Rd
- 24 Plantation Rd
- 367 Hickory Springs Place Unit 4
- 210 Buena Vista St Unit Lot 1
- 210 Buena Vista St
Your Personal Tour Guide
Ask me questions while you tour the home.