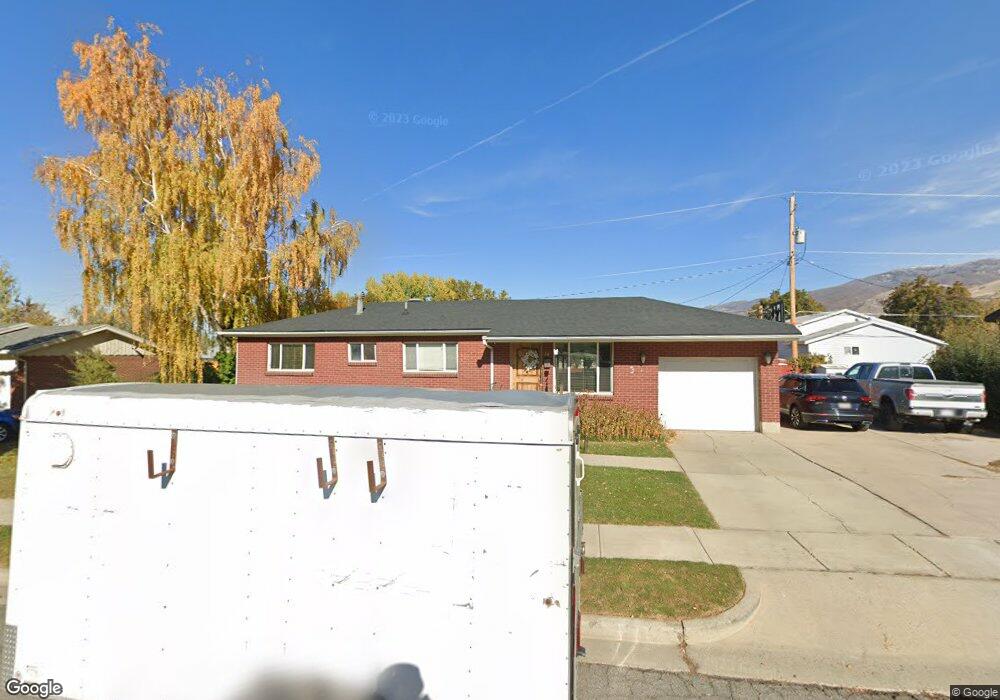
38 W 1300 S Bountiful, UT 84010
Estimated Value: $452,000 - $547,000
4
Beds
2
Baths
946
Sq Ft
$519/Sq Ft
Est. Value
About This Home
This home is located at 38 W 1300 S, Bountiful, UT 84010 and is currently estimated at $490,777, approximately $518 per square foot. 38 W 1300 S is a home located in Davis County with nearby schools including Bountiful Elementary School, Millcreek Junior High School, and Bountiful High School.
Ownership History
Date
Name
Owned For
Owner Type
Purchase Details
Closed on
May 12, 2021
Sold by
Blaser Benjamin
Bought by
Blaser Benjamin J and Blaser Christie A
Current Estimated Value
Purchase Details
Closed on
Jan 9, 2007
Sold by
Key Team Llc
Bought by
Blaser Benjamin
Home Financials for this Owner
Home Financials are based on the most recent Mortgage that was taken out on this home.
Original Mortgage
$181,000
Interest Rate
6.12%
Mortgage Type
Purchase Money Mortgage
Create a Home Valuation Report for This Property
The Home Valuation Report is an in-depth analysis detailing your home's value as well as a comparison with similar homes in the area
Home Values in the Area
Average Home Value in this Area
Purchase History
| Date | Buyer | Sale Price | Title Company |
|---|---|---|---|
| Blaser Benjamin J | -- | North American Title Llc | |
| Blaser Benjamin | -- | Premier Title Insurance | |
| Key Team Llc | -- | Premier Title Insurance Agen |
Source: Public Records
Mortgage History
| Date | Status | Borrower | Loan Amount |
|---|---|---|---|
| Previous Owner | Key Team Llc | $181,000 |
Source: Public Records
Tax History Compared to Growth
Tax History
| Year | Tax Paid | Tax Assessment Tax Assessment Total Assessment is a certain percentage of the fair market value that is determined by local assessors to be the total taxable value of land and additions on the property. | Land | Improvement |
|---|---|---|---|---|
| 2025 | $2,688 | $245,300 | $119,363 | $125,937 |
| 2024 | $2,500 | $237,049 | $103,064 | $133,985 |
| 2023 | $2,402 | $227,150 | $106,134 | $121,015 |
| 2022 | $2,532 | $435,000 | $193,250 | $241,750 |
| 2021 | $2,307 | $333,000 | $138,956 | $194,044 |
| 2020 | $1,901 | $274,000 | $121,260 | $152,740 |
| 2019 | $1,924 | $271,000 | $135,195 | $135,805 |
| 2018 | $1,783 | $247,000 | $132,691 | $114,309 |
| 2016 | $1,512 | $113,245 | $52,919 | $60,326 |
| 2015 | $1,489 | $105,325 | $52,919 | $52,406 |
| 2014 | $1,539 | $112,356 | $52,919 | $59,437 |
| 2013 | -- | $95,287 | $40,825 | $54,462 |
Source: Public Records
Map
Nearby Homes
- 90 W 1300 S
- 1350 S 200 W
- 1314 S 200 W Unit 19
- 99 E 1600 S
- 141 E 1650 S
- 650 S Main St Unit 6111
- 650 S Main St Unit 1301
- 254 W 650 S
- 545 S 100 E
- 360 W 800 S
- 285 E 1650 S
- 34 W 400 S
- 32 W 400 S
- 990 S 500 W
- 46 W 400 S
- 288 E Peach Ln S
- 305 E Peach Ln S Unit G
- 553 Clark St
- 1950 S 200 W Unit 32
- 33 W Wicker Ln