38 W 8th St Dresden, OH 43821
Estimated Value: $184,000 - $256,000
3
Beds
2
Baths
2,395
Sq Ft
$92/Sq Ft
Est. Value
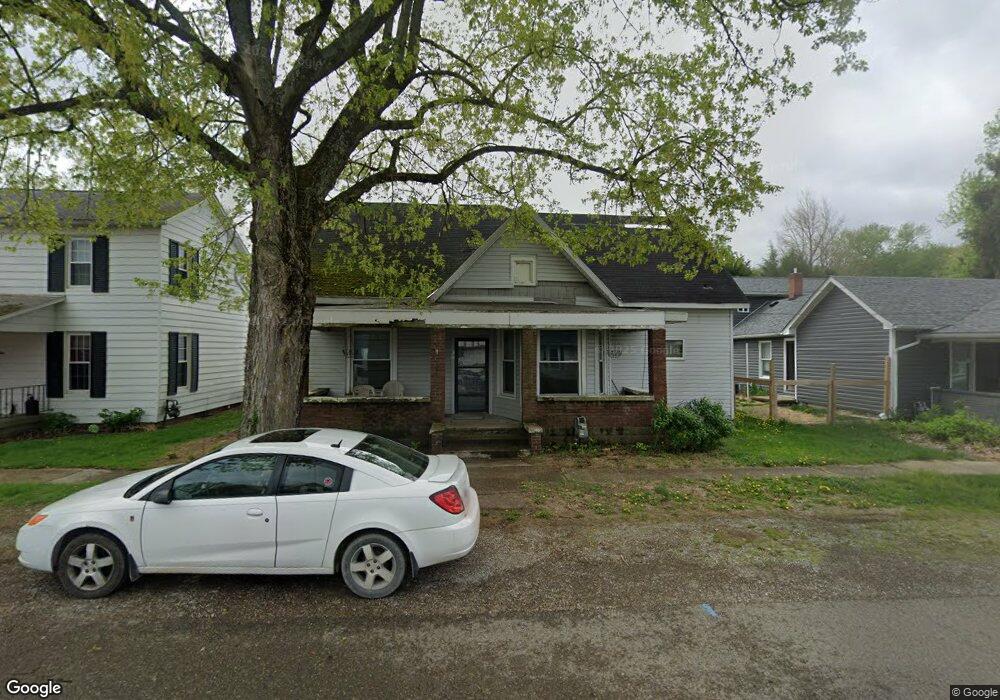
About This Home
This home is located at 38 W 8th St, Dresden, OH 43821 and is currently estimated at $220,835, approximately $92 per square foot. 38 W 8th St is a home located in Muskingum County with nearby schools including Tri-Valley High School.
Ownership History
Date
Name
Owned For
Owner Type
Purchase Details
Closed on
Mar 26, 2009
Sold by
Century National Bank
Bought by
Williams Eric S and Williams Karrie R
Current Estimated Value
Home Financials for this Owner
Home Financials are based on the most recent Mortgage that was taken out on this home.
Original Mortgage
$150,000
Outstanding Balance
$39,180
Interest Rate
5.11%
Mortgage Type
Future Advance Clause Open End Mortgage
Estimated Equity
$181,655
Purchase Details
Closed on
Feb 26, 2009
Sold by
Solt Charles J and Solt Karen L
Bought by
Century National Bank
Home Financials for this Owner
Home Financials are based on the most recent Mortgage that was taken out on this home.
Original Mortgage
$150,000
Outstanding Balance
$39,180
Interest Rate
5.11%
Mortgage Type
Future Advance Clause Open End Mortgage
Estimated Equity
$181,655
Purchase Details
Closed on
Jan 21, 2005
Sold by
Sabo Mark E and Sabo Cindy L
Bought by
Solt Charles J
Home Financials for this Owner
Home Financials are based on the most recent Mortgage that was taken out on this home.
Original Mortgage
$76,000
Interest Rate
7%
Mortgage Type
Purchase Money Mortgage
Create a Home Valuation Report for This Property
The Home Valuation Report is an in-depth analysis detailing your home's value as well as a comparison with similar homes in the area
Purchase History
| Date | Buyer | Sale Price | Title Company |
|---|---|---|---|
| Williams Eric S | $45,000 | None Available | |
| Century National Bank | $28,000 | Attorney | |
| Solt Charles J | $88,000 | -- |
Source: Public Records
Mortgage History
| Date | Status | Borrower | Loan Amount |
|---|---|---|---|
| Open | Williams Eric S | $150,000 | |
| Previous Owner | Solt Charles J | $76,000 |
Source: Public Records
Tax History
| Year | Tax Paid | Tax Assessment Tax Assessment Total Assessment is a certain percentage of the fair market value that is determined by local assessors to be the total taxable value of land and additions on the property. | Land | Improvement |
|---|---|---|---|---|
| 2024 | $2,024 | $44,380 | $3,640 | $40,740 |
| 2023 | $1,499 | $33,460 | $2,765 | $30,695 |
| 2022 | $1,473 | $33,460 | $2,765 | $30,695 |
| 2021 | $1,322 | $33,460 | $2,765 | $30,695 |
| 2020 | $1,126 | $30,415 | $2,520 | $27,895 |
| 2019 | $1,191 | $30,415 | $2,520 | $27,895 |
| 2018 | $1,018 | $30,415 | $2,520 | $27,895 |
| 2017 | $868 | $20,685 | $2,520 | $18,165 |
| 2016 | $881 | $20,690 | $2,520 | $18,170 |
| 2015 | $892 | $20,690 | $2,520 | $18,170 |
| 2013 | $1,031 | $20,690 | $2,520 | $18,170 |
Source: Public Records
Map
Nearby Homes
- 510 Chestnut St
- 35 W 5th St
- 1309 Main St
- 1324 Chestnut St
- 10170 N Morrison Rd
- 3595 Maplecraft Dr
- 9520 McGlade School Rd
- 4797 Narrows Rd
- 7360 Jones Rd
- 0 Eddleblute Dr
- 7034 Eaglepoint Dr
- 13300 Mount Zion Rd
- 6705 Frazeysburd Rd
- 6705 Frazeysburg Rd
- 11700 Scout Rd
- 2955 Tarkman Dr
- 101 W 2nd St
- 165 W 3rd St
- 6295 Dresden Rd
- 148 4th St
Your Personal Tour Guide
Ask me questions while you tour the home.