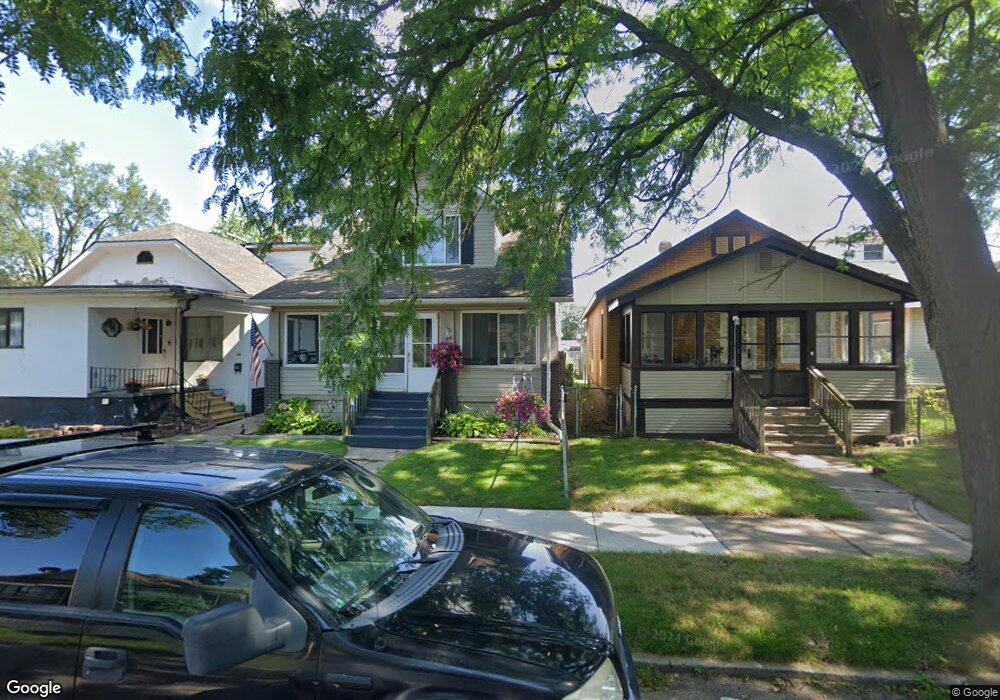
38 W Broadway St Ecorse, MI 48229
Estimated Value: $104,000 - $129,000
--
Bed
--
Bath
1,416
Sq Ft
$84/Sq Ft
Est. Value
About This Home
This home is located at 38 W Broadway St, Ecorse, MI 48229 and is currently estimated at $118,654, approximately $83 per square foot. 38 W Broadway St is a home located in Wayne County with nearby schools including Ralph J. Bunche Elementary, Grandport Academy, and Ecorse High School.
Ownership History
Date
Name
Owned For
Owner Type
Purchase Details
Closed on
Nov 22, 2011
Sold by
Wayne County Treasurer
Bought by
Broome James P
Current Estimated Value
Purchase Details
Closed on
Apr 1, 2011
Sold by
Downriver Family Housing
Bought by
Detroit Commerce Bank
Purchase Details
Closed on
Jan 7, 2008
Sold by
Fannie Mae
Bought by
Downriver Family Housing Llc
Purchase Details
Closed on
Sep 17, 2007
Sold by
Netbank
Bought by
Federal National Mortgage Association
Purchase Details
Closed on
Nov 15, 2006
Sold by
Dillion Joshua and Dillion Susan
Bought by
Netbank
Purchase Details
Closed on
Mar 12, 2003
Sold by
Woolsey Richard D and Woolsey Rebecca
Bought by
Dillion Joshua
Purchase Details
Closed on
Mar 8, 2002
Sold by
Woolsey Rebecca A
Bought by
Hanson Erick J
Purchase Details
Closed on
Oct 28, 1994
Sold by
Martinez Julio A
Bought by
Harris Howard G and Harris Larry
Create a Home Valuation Report for This Property
The Home Valuation Report is an in-depth analysis detailing your home's value as well as a comparison with similar homes in the area
Home Values in the Area
Average Home Value in this Area
Purchase History
| Date | Buyer | Sale Price | Title Company |
|---|---|---|---|
| Broome James P | $925 | None Available | |
| Detroit Commerce Bank | -- | None Available | |
| Downriver Family Housing Llc | $5,000 | Greco | |
| Federal National Mortgage Association | -- | Greco | |
| Netbank | $89,615 | None Available | |
| Dillion Joshua | $80,000 | Michigan Title Insurance Age | |
| Woolsey Richard D | -- | Multiple | |
| Hanson Erick J | -- | -- | |
| Harris Howard G | $19,500 | -- |
Source: Public Records
Tax History Compared to Growth
Tax History
| Year | Tax Paid | Tax Assessment Tax Assessment Total Assessment is a certain percentage of the fair market value that is determined by local assessors to be the total taxable value of land and additions on the property. | Land | Improvement |
|---|---|---|---|---|
| 2025 | $966 | $52,600 | $0 | $0 |
| 2024 | $966 | $48,300 | $0 | $0 |
| 2023 | $920 | $41,500 | $0 | $0 |
| 2022 | $1,776 | $33,500 | $0 | $0 |
| 2021 | $1,821 | $25,700 | $0 | $0 |
| 2019 | $1,763 | $18,900 | $0 | $0 |
| 2018 | $827 | $15,300 | $0 | $0 |
| 2017 | $1,742 | $15,200 | $0 | $0 |
| 2016 | $1,781 | $16,000 | $0 | $0 |
| 2013 | $3,200 | $33,700 | $0 | $0 |
| 2012 | $2,248 | $34,700 | $2,600 | $32,100 |
Source: Public Records
Map
Nearby Homes
- 4067 High St
- 28 Salliotte Rd
- 32 W Woodward St
- 43 W Alexis St
- 10 W Broadway St
- 46 W Westfield St
- 53 W Charlotte St
- 25 W Charlotte St
- 19 E Josephine St
- 36 W Charlotte St
- 44 Cherrygrove St
- 54 Elton St
- 4234 High St
- 18 Bonzanno St
- 28 Bonzanno St
- 35 & 39 Knox St
- 4241 6th St
- 3982 9th St
- 50 W Benson St
- 40 W Benson St
- 36 W Broadway St
- 40 W Broadway St
- 34 W Broadway St
- 41 W Josephine St
- 43 W Josephine St
- 46 W Broadway St
- 28 W Broadway St
- 39 W Josephine St
- 45 W Josephine St
- 35 W Josephine St
- 47 W Josephine St
- 35 W Broadway St
- 48 W Broadway St
- 37 W Broadway St
- 39 W Broadway St
- 41 W Broadway St
- 31 W Josephine St
- 26 W Broadway St
- 49 W Josephine St
- 29 W Broadway St