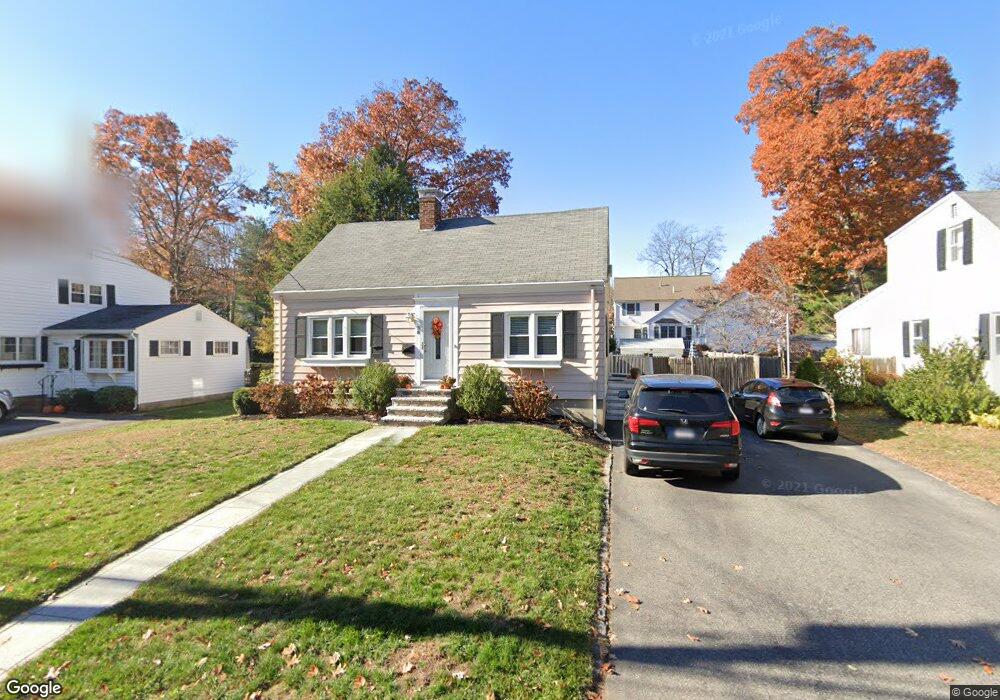
38 West St Stoneham, MA 02180
Lindenwood NeighborhoodEstimated Value: $785,000 - $936,000
3
Beds
3
Baths
1,840
Sq Ft
$462/Sq Ft
Est. Value
About This Home
This home is located at 38 West St, Stoneham, MA 02180 and is currently estimated at $849,376, approximately $461 per square foot. 38 West St is a home located in Middlesex County with nearby schools including Stoneham High School, St. Patrick Elementary School, and Greater Boston Academy.
Ownership History
Date
Name
Owned For
Owner Type
Purchase Details
Closed on
Aug 20, 2007
Sold by
Mcgonagle Alice
Bought by
Oxford Gregory C and Mcgonagle Rita A
Current Estimated Value
Home Financials for this Owner
Home Financials are based on the most recent Mortgage that was taken out on this home.
Original Mortgage
$268,000
Outstanding Balance
$169,771
Interest Rate
6.67%
Mortgage Type
Purchase Money Mortgage
Estimated Equity
$679,605
Create a Home Valuation Report for This Property
The Home Valuation Report is an in-depth analysis detailing your home's value as well as a comparison with similar homes in the area
Home Values in the Area
Average Home Value in this Area
Purchase History
| Date | Buyer | Sale Price | Title Company |
|---|---|---|---|
| Oxford Gregory C | -- | -- |
Source: Public Records
Mortgage History
| Date | Status | Borrower | Loan Amount |
|---|---|---|---|
| Open | Oxford Gregory C | $268,000 |
Source: Public Records
Tax History Compared to Growth
Tax History
| Year | Tax Paid | Tax Assessment Tax Assessment Total Assessment is a certain percentage of the fair market value that is determined by local assessors to be the total taxable value of land and additions on the property. | Land | Improvement |
|---|---|---|---|---|
| 2025 | $8,153 | $797,000 | $388,500 | $408,500 |
| 2024 | $7,876 | $743,700 | $370,000 | $373,700 |
| 2023 | $7,588 | $683,600 | $333,000 | $350,600 |
| 2022 | $5,586 | $536,600 | $305,300 | $231,300 |
| 2021 | $5,545 | $512,500 | $286,800 | $225,700 |
| 2020 | $5,434 | $503,600 | $282,100 | $221,500 |
| 2019 | $5,438 | $484,700 | $263,200 | $221,500 |
| 2018 | $5,093 | $434,900 | $227,500 | $207,400 |
| 2017 | $4,970 | $401,100 | $220,000 | $181,100 |
| 2016 | $4,637 | $365,100 | $193,600 | $171,500 |
| 2015 | $4,412 | $340,400 | $184,800 | $155,600 |
| 2014 | $4,391 | $325,500 | $176,000 | $149,500 |
Source: Public Records
Map
Nearby Homes
- 12 Cottage St
- 20 Oak St
- 10 Pomeworth St Unit H
- 1 Tremont St
- 200 Ledgewood Dr Unit 505
- 100 Ledgewood Dr Unit 618
- 21 Tremont St Unit A
- 159 Main St Unit 41C
- 405 William St
- 43 Pomeworth St Unit 44
- 17A 17 B Emerson
- 17 Emerson St Unit A
- 8 Steele St
- 13 Washington Ave
- 25 Penny Ln
- 20 Myrtle St
- 34 Warren St Unit 3
- 34 Duncklee Ave
- 97 Oak St
- 62 High St Unit 4