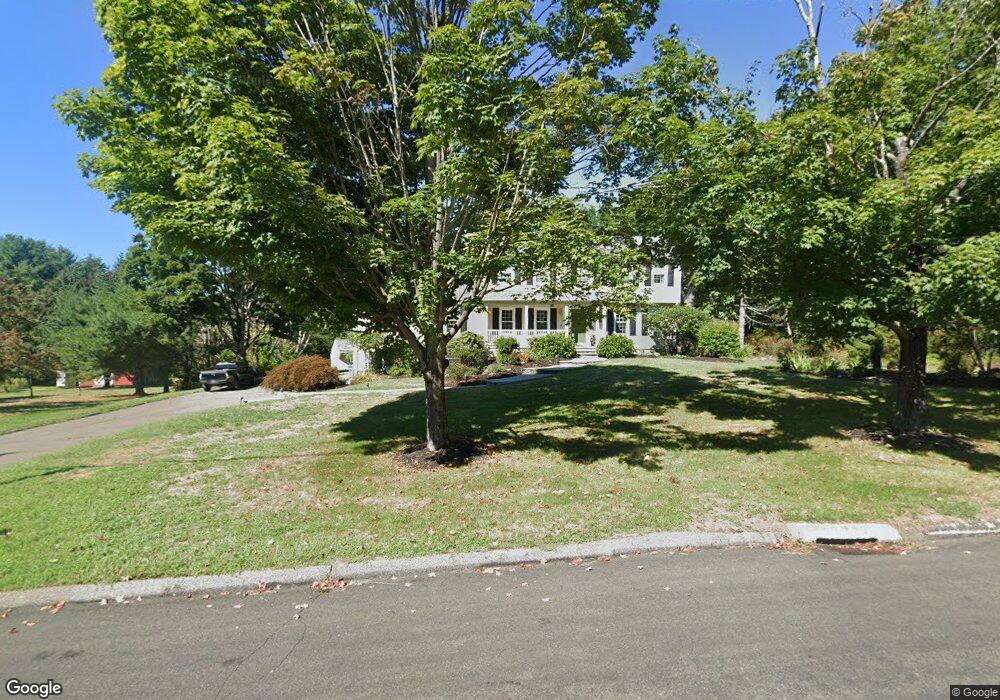
38 Wigwam Dr Shelton, CT 06484
Estimated Value: $704,000 - $858,000
4
Beds
4
Baths
2,536
Sq Ft
$306/Sq Ft
Est. Value
About This Home
This home is located at 38 Wigwam Dr, Shelton, CT 06484 and is currently estimated at $776,528, approximately $306 per square foot. 38 Wigwam Dr is a home located in Fairfield County with nearby schools including Mohegan Elementary School, Perry Hill School, and Shelton Intermediate School.
Ownership History
Date
Name
Owned For
Owner Type
Purchase Details
Closed on
Aug 28, 1998
Sold by
Ciappetta John and Ciappetta Dawn
Bought by
Lam Xia V and Lam Katie T
Current Estimated Value
Home Financials for this Owner
Home Financials are based on the most recent Mortgage that was taken out on this home.
Original Mortgage
$283,500
Interest Rate
6.9%
Mortgage Type
Unknown
Create a Home Valuation Report for This Property
The Home Valuation Report is an in-depth analysis detailing your home's value as well as a comparison with similar homes in the area
Home Values in the Area
Average Home Value in this Area
Purchase History
| Date | Buyer | Sale Price | Title Company |
|---|---|---|---|
| Lam Xia V | $315,000 | -- | |
| Lam Xia V | $315,000 | -- |
Source: Public Records
Mortgage History
| Date | Status | Borrower | Loan Amount |
|---|---|---|---|
| Closed | Lam Xia V | $270,280 | |
| Closed | Lam Xia V | $283,500 | |
| Previous Owner | Lam Xia V | $265,000 |
Source: Public Records
Tax History Compared to Growth
Tax History
| Year | Tax Paid | Tax Assessment Tax Assessment Total Assessment is a certain percentage of the fair market value that is determined by local assessors to be the total taxable value of land and additions on the property. | Land | Improvement |
|---|---|---|---|---|
| 2025 | $7,180 | $381,500 | $109,200 | $272,300 |
| 2024 | $7,317 | $381,500 | $109,200 | $272,300 |
| 2023 | $6,665 | $381,500 | $109,200 | $272,300 |
| 2022 | $6,665 | $381,500 | $109,200 | $272,300 |
| 2021 | $7,822 | $355,040 | $72,590 | $282,450 |
| 2020 | $7,960 | $355,040 | $72,590 | $282,450 |
| 2019 | $7,960 | $355,040 | $72,590 | $282,450 |
| 2017 | $7,885 | $355,040 | $72,590 | $282,450 |
| 2015 | $7,570 | $339,290 | $69,790 | $269,500 |
| 2014 | $7,570 | $339,290 | $69,790 | $269,500 |
Source: Public Records
Map
Nearby Homes