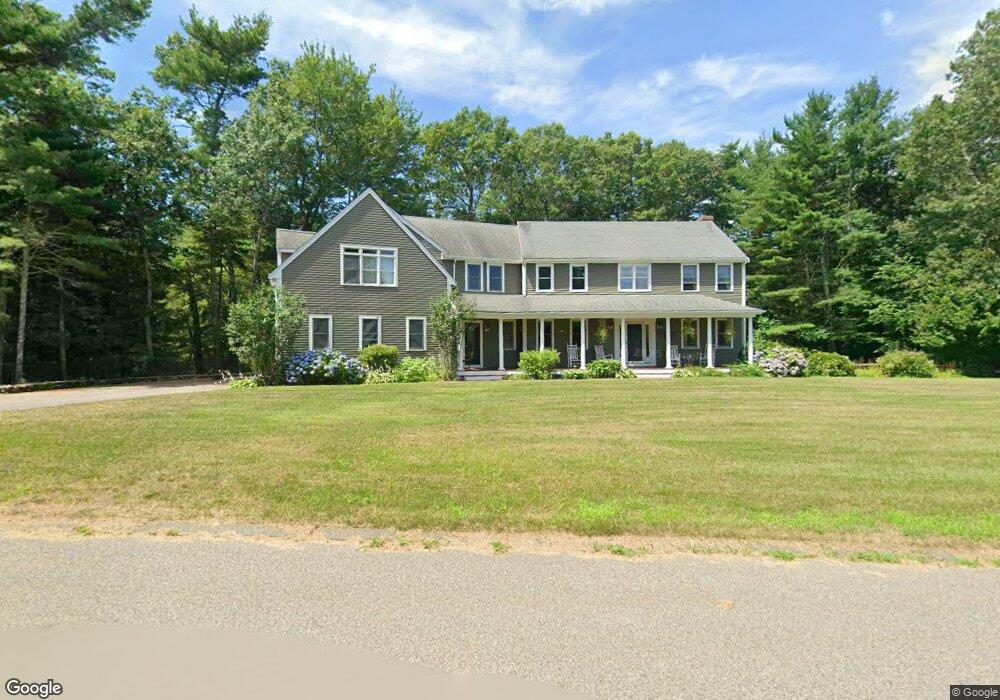
38 Wilder Rd Kingston, MA 02364
Estimated Value: $935,454 - $1,095,000
4
Beds
4
Baths
3,211
Sq Ft
$317/Sq Ft
Est. Value
About This Home
This home is located at 38 Wilder Rd, Kingston, MA 02364 and is currently estimated at $1,017,114, approximately $316 per square foot. 38 Wilder Rd is a home located in Plymouth County with nearby schools including Silver Lake Regional High School, Kingston Elementary School, and Kingston Intermediate School.
Ownership History
Date
Name
Owned For
Owner Type
Purchase Details
Closed on
May 15, 2025
Sold by
Harrington Thomas E
Bought by
38 Wilder Rd Rt and Harrington
Current Estimated Value
Purchase Details
Closed on
May 23, 1996
Sold by
North East Bldrs Inc
Bought by
Harrington Thomas E and Harrington Nicola G
Create a Home Valuation Report for This Property
The Home Valuation Report is an in-depth analysis detailing your home's value as well as a comparison with similar homes in the area
Home Values in the Area
Average Home Value in this Area
Purchase History
| Date | Buyer | Sale Price | Title Company |
|---|---|---|---|
| 38 Wilder Rd Rt | -- | None Available | |
| 38 Wilder Rd Rt | -- | None Available | |
| Harrington Thomas E | $190,500 | -- | |
| North East Bldrs Inc | $65,000 | -- | |
| North East Bldrs Inc | $65,000 | -- |
Source: Public Records
Mortgage History
| Date | Status | Borrower | Loan Amount |
|---|---|---|---|
| Previous Owner | North East Bldrs Inc | $362,000 | |
| Previous Owner | North East Bldrs Inc | $125,000 |
Source: Public Records
Tax History
| Year | Tax Paid | Tax Assessment Tax Assessment Total Assessment is a certain percentage of the fair market value that is determined by local assessors to be the total taxable value of land and additions on the property. | Land | Improvement |
|---|---|---|---|---|
| 2025 | $10,621 | $818,900 | $233,000 | $585,900 |
| 2024 | $9,735 | $765,900 | $233,000 | $532,900 |
| 2023 | $9,433 | $706,100 | $233,000 | $473,100 |
| 2022 | $9,063 | $621,600 | $206,800 | $414,800 |
| 2021 | $9,278 | $577,000 | $206,800 | $370,200 |
| 2020 | $9,179 | $563,800 | $206,800 | $357,000 |
| 2019 | $8,989 | $546,100 | $206,800 | $339,300 |
| 2018 | $3,180 | $506,300 | $206,800 | $299,500 |
| 2017 | $8,375 | $507,600 | $200,700 | $306,900 |
| 2016 | $7,764 | $440,900 | $190,300 | $250,600 |
| 2015 | $7,540 | $445,100 | $190,300 | $254,800 |
| 2014 | $7,544 | $452,300 | $193,400 | $258,900 |
Source: Public Records
Map
Nearby Homes
- 83 Wapping Rd
- 167 Grove St
- 46 Foxworth Ln
- 1 Oldfield Dr
- 2 Clinton Terrace
- 15 Forest St
- 278 Main St
- 12 Meeting House Rd
- 44 Meeting House Rd
- 3 Natureway Cir
- 53 Beechwood Rd
- 20 Forestdale Dr
- Lot 17-1 Howland's Ln
- 1 Ferndale Dr
- 8 Beechwood Rd
- 63 Sycamore Dr
- 68 Sycamore Dr
- 342 Country Club Way
- 28 Brook St
- 171 Pine St
Your Personal Tour Guide
Ask me questions while you tour the home.