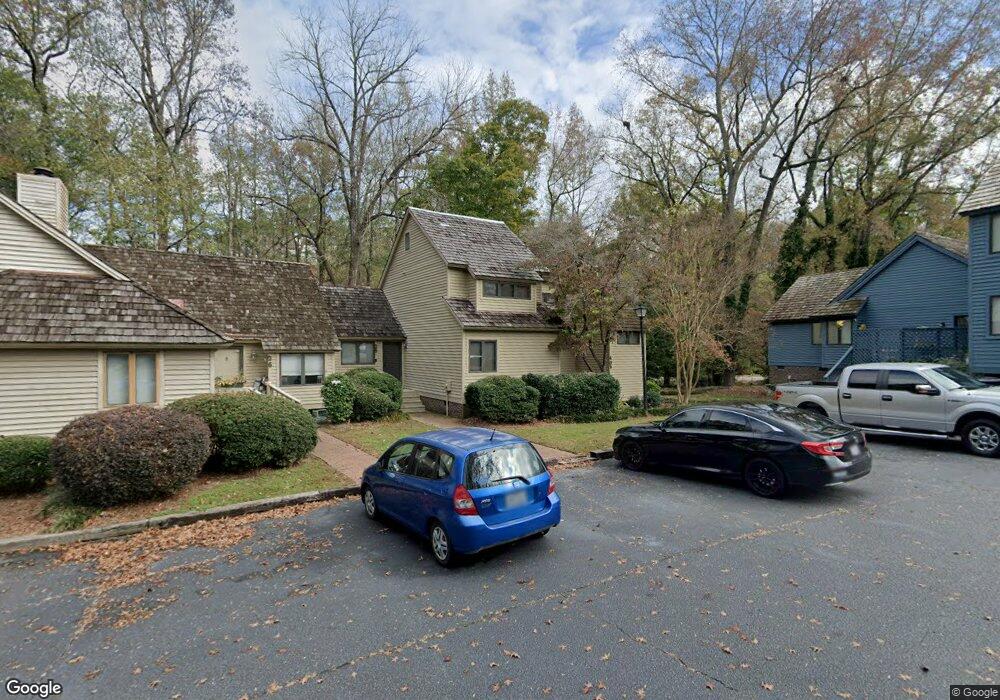
38 Winders Creek Rocky Mount, NC 27804
Estimated Value: $162,000 - $259,000
2
Beds
2
Baths
1,245
Sq Ft
$160/Sq Ft
Est. Value
About This Home
This home is located at 38 Winders Creek, Rocky Mount, NC 27804 and is currently estimated at $199,174, approximately $159 per square foot. 38 Winders Creek is a home located in Nash County with nearby schools including Englewood Elementary School, Rocky Mount Middle School, and G.R. Edwards Middle School.
Ownership History
Date
Name
Owned For
Owner Type
Purchase Details
Closed on
Jan 11, 2017
Sold by
Rabil James E
Bought by
Rabil Brothers Llc
Current Estimated Value
Purchase Details
Closed on
Jan 11, 2016
Sold by
Rabil James E
Bought by
Rabil Brothers Llc
Purchase Details
Closed on
Jan 10, 2016
Sold by
Rabil James E
Bought by
Rabil Phillip Edward
Purchase Details
Closed on
Dec 18, 2015
Sold by
Rabil James E
Bought by
Rabil Brothers Llc
Purchase Details
Closed on
Dec 16, 2015
Sold by
Rabil Phillip Edward
Bought by
Rabil James E and Phillip Edward Rabil 1999 Trust
Purchase Details
Closed on
Dec 15, 2015
Sold by
Rabil James E
Bought by
Rabil Phillip Edward
Create a Home Valuation Report for This Property
The Home Valuation Report is an in-depth analysis detailing your home's value as well as a comparison with similar homes in the area
Home Values in the Area
Average Home Value in this Area
Purchase History
| Date | Buyer | Sale Price | Title Company |
|---|---|---|---|
| Rabil Brothers Llc | -- | None Available | |
| Rabil James E | -- | None Available | |
| Rabil Brothers Llc | -- | None Available | |
| Rabil Brothers Llc | -- | Attorney | |
| Rabil James E | -- | Attorney | |
| Rabil Brothers Llc | -- | Attorney | |
| Rabil Phillip Edward | -- | Attorney | |
| Rabil James E | -- | Attorney | |
| Rabil Brothers Llc | -- | None Available | |
| Rabil Brothers Llc | -- | None Available | |
| Rabil James E | -- | None Available | |
| Rabil Phillip Edward | -- | None Available | |
| Rabil James E | -- | None Available |
Source: Public Records
Tax History Compared to Growth
Tax History
| Year | Tax Paid | Tax Assessment Tax Assessment Total Assessment is a certain percentage of the fair market value that is determined by local assessors to be the total taxable value of land and additions on the property. | Land | Improvement |
|---|---|---|---|---|
| 2025 | $941 | $149,360 | $9,560 | $139,800 |
| 2024 | $941 | $93,680 | $8,600 | $85,080 |
| 2023 | $628 | $93,680 | $0 | $0 |
| 2022 | $628 | $93,680 | $8,600 | $85,080 |
| 2021 | $628 | $93,680 | $8,600 | $85,080 |
| 2020 | $628 | $93,680 | $8,600 | $85,080 |
| 2019 | $628 | $93,680 | $8,600 | $85,080 |
| 2018 | $628 | $93,680 | $0 | $0 |
| 2017 | $628 | $93,680 | $0 | $0 |
| 2015 | $635 | $94,724 | $0 | $0 |
| 2014 | $635 | $94,724 | $0 | $0 |
Source: Public Records
Map
Nearby Homes
- 4024 Sunset Ave
- 129 Steeple Chase Rd
- 213 Braylock Dr
- 2708 Coleberry Trail
- 128 Bridgeport Ct
- 4228 Belgreen Dr
- 152 Candlewood Rd
- 232 Braylock Dr
- 153 Candlewood Rd
- 117 Tam o Shanter Dr
- 54 E Maple Ct Unit 54
- 3821 Mansfield Dr
- 3782 Loblolly Dr Unit 5
- 3782 Loblolly Dr
- 325 Old Coach Rd
- 4001 Lochinvar Ln
- 322 Gravely Dr
- 4181 Shelly Dr Unit 4181
- 3713 Winchester Rd
- 116 Ashcroft Ct
- 40 Winders Creek
- 36 Winders Creek
- 34 Winders Creek
- 44 Winders Creek
- 42 Winders Creek
- 46 Winders Creek
- 32 Winders Creek
- 29 Winders Creek
- 30 Winders Creek
- 48 Winders Creek
- 28 Winders Creek
- 26 Winders Creek
- 24 Winders Creek
- 22 Winders Creek
- 3400 Weatherstone Dr
- 18 Winders Creek
- 20 Winders Creek
- 67 Weatherstone Dr
- 3401 Weatherstone Dr
- 63 Weatherstone Dr