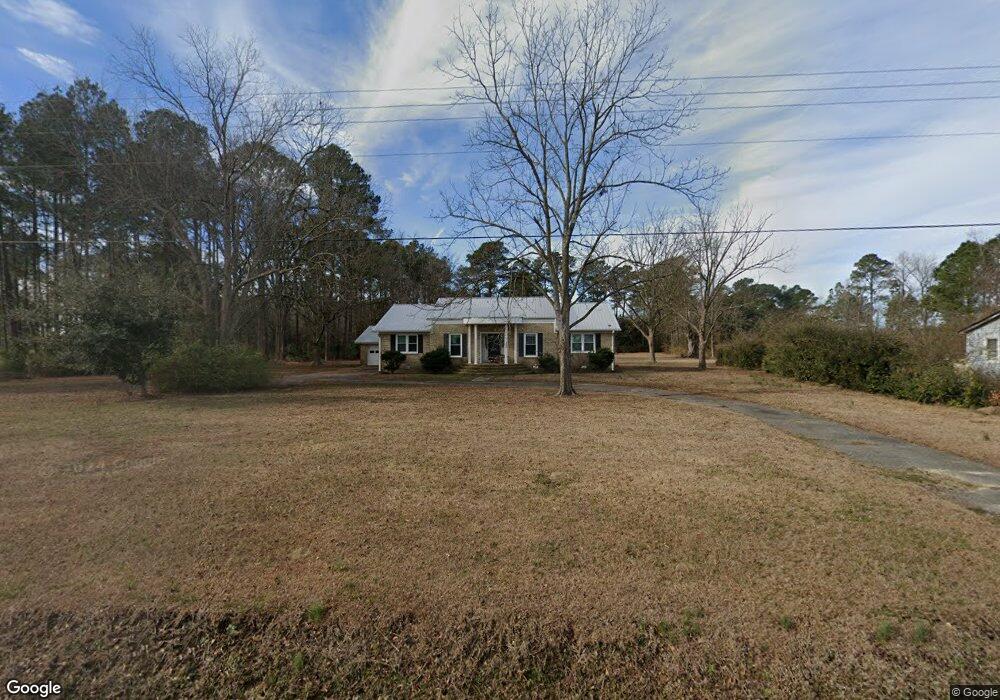
380 Ai Taylor Rd Richlands, NC 28574
Estimated Value: $272,000 - $356,000
3
Beds
3
Baths
2,026
Sq Ft
$158/Sq Ft
Est. Value
About This Home
This home is located at 380 Ai Taylor Rd, Richlands, NC 28574 and is currently estimated at $320,540, approximately $158 per square foot. 380 Ai Taylor Rd is a home located in Onslow County with nearby schools including Richlands Elementary School, Trexler Middle School, and Richlands High School.
Ownership History
Date
Name
Owned For
Owner Type
Purchase Details
Closed on
Mar 27, 2025
Sold by
Bryan Sylvia H
Bought by
Juniper Lane Llc
Current Estimated Value
Purchase Details
Closed on
Nov 12, 2010
Bought by
Bryan Ousby Richard
Purchase Details
Closed on
Aug 21, 2008
Sold by
Mckenzie Christopher D and Mckenzie Katherine
Bought by
Mcdonald Zachary A and Mcdonald Amy E
Home Financials for this Owner
Home Financials are based on the most recent Mortgage that was taken out on this home.
Original Mortgage
$218,450
Interest Rate
6.48%
Mortgage Type
VA
Purchase Details
Closed on
Aug 30, 2005
Sold by
Mauro Filippo and Mauro Gladys
Bought by
Mckenzie Christopher D and Mckenzie Katherine
Home Financials for this Owner
Home Financials are based on the most recent Mortgage that was taken out on this home.
Original Mortgage
$134,000
Interest Rate
5.86%
Mortgage Type
New Conventional
Create a Home Valuation Report for This Property
The Home Valuation Report is an in-depth analysis detailing your home's value as well as a comparison with similar homes in the area
Home Values in the Area
Average Home Value in this Area
Purchase History
| Date | Buyer | Sale Price | Title Company |
|---|---|---|---|
| Juniper Lane Llc | -- | None Listed On Document | |
| Juniper Lane Llc | -- | None Listed On Document | |
| Bryan Ousby Richard | $160,000 | -- | |
| Mcdonald Zachary A | $211,500 | None Available | |
| Mckenzie Christopher D | $172,000 | None Available |
Source: Public Records
Mortgage History
| Date | Status | Borrower | Loan Amount |
|---|---|---|---|
| Previous Owner | Mcdonald Zachary A | $218,450 | |
| Previous Owner | Mckenzie Christopher D | $134,000 |
Source: Public Records
Tax History Compared to Growth
Tax History
| Year | Tax Paid | Tax Assessment Tax Assessment Total Assessment is a certain percentage of the fair market value that is determined by local assessors to be the total taxable value of land and additions on the property. | Land | Improvement |
|---|---|---|---|---|
| 2025 | $1,440 | $219,826 | $40,720 | $179,106 |
| 2024 | $1,440 | $219,826 | $40,720 | $179,106 |
| 2023 | $1,440 | $219,826 | $40,720 | $179,106 |
| 2022 | $1,440 | $219,826 | $40,720 | $179,106 |
| 2021 | $1,149 | $162,910 | $30,040 | $132,870 |
| 2020 | $1,084 | $153,780 | $30,040 | $123,740 |
| 2019 | $1,084 | $153,780 | $30,040 | $123,740 |
| 2018 | $1,084 | $153,780 | $30,040 | $123,740 |
| 2017 | $1,025 | $151,890 | $28,040 | $123,850 |
| 2016 | $1,025 | $151,890 | $0 | $0 |
| 2015 | $1,025 | $151,890 | $0 | $0 |
| 2014 | $1,025 | $151,890 | $0 | $0 |
Source: Public Records
Map
Nearby Homes
- 105 Conley Hills Dr
- 353 Potters Hill Rd
- 605 Central Park Way
- 200 Classy Ct
- 9063 Hwy 41 W
- 101 Loyd Ln
- 795 Haw Branch Rd
- 113 Woodwater Dr
- 122 Watering Pond Rd
- 129 Dallas Dr
- 133 Dallas Dr
- 136 Dallas Dr
- 138 Dallas Dr
- 140 Dallas Dr
- 202 Quarry Trail
- 100 Buckhaven Dr
- Off Barbee Rd
- 9572 Hwy 41 W
- 226 Beulaville Hwy
- 1070 Gregory Fork Rd
- 380 A I Taylor Rd
- 372 Ai Taylor Rd
- 390 Ai Taylor Rd
- 377 Ai Taylor Rd
- 383 Ai Taylor Rd
- 394 Ai Taylor Rd
- 389 Ai Taylor Rd
- 363 Ai Taylor Rd
- 398 Ai Taylor Rd
- 363 A I Taylor Rd
- 119 Shady Grove Ln
- 402 Ai Taylor Rd
- 401 Ai Taylor Rd
- 355 A I Taylor Rd
- 397 Ai Taylor Rd
- 351 A I Taylor Rd
- 351 Ai Taylor Rd
- 410 Ai Taylor Rd
- 347 Ai Taylor Rd
- 343 A I Taylor Rd